 icon and can even click any of the interesting graphs for more information on the same.
Chapter 2 Dashboard
Home Dashboard displays the below widgets by default:
Ø Incidents trend
Ø Attackers map
Ø Unknown/dormant malware
Ø Targets
Ø Non-reporting systems
Ø Casebook
Ø Log volume trend
NOTE: Edit option is not available for some of the custom dashlets such as Attackers, Non reporting system, and Casebook.
The user can re-arrange the dashlets as per requirement; make configuration changes by clicking the edit dashlet icon and can even click any of the interesting graphs for more information on the same.
This option helps to view quick statistics and graphs like trend of events based on any flex persisted data. My dashboard is an enhanced feature, where the dashboard can be configured as well as customized according to user preferences.
With the introduction of CIM model in EventTracker v9.0, all the logs/events are now normalized and mapped to common schema for the last 7 days.
For Example: Just search with “tags:"login failed"” to get login failure results from any source (VPN, Active Directory, Firewall etc.) without worrying about event id or any other property.
1) To view My Dashboard, click the Dashboard icon, and select My Dashboard from the dropdown list.
2) To add a dashboard, click the add icon![]() .
.
EventTracker displays the Custom dashboard window.

3) Enter Title and Description and click on the Save button.
4) The customized dashboard gets added and is displayed.
5) For configuring a widget based on Flex persisted report, click the configure icon![]() .
.
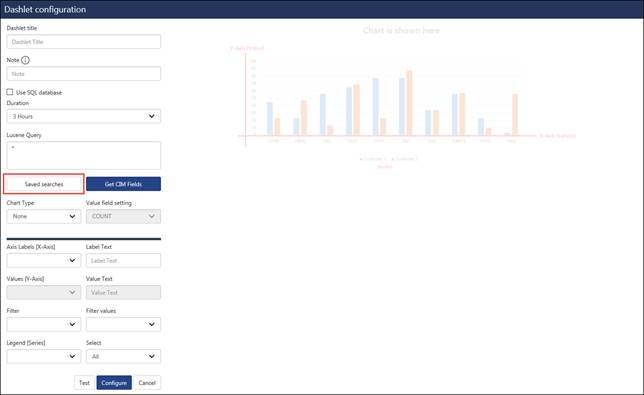
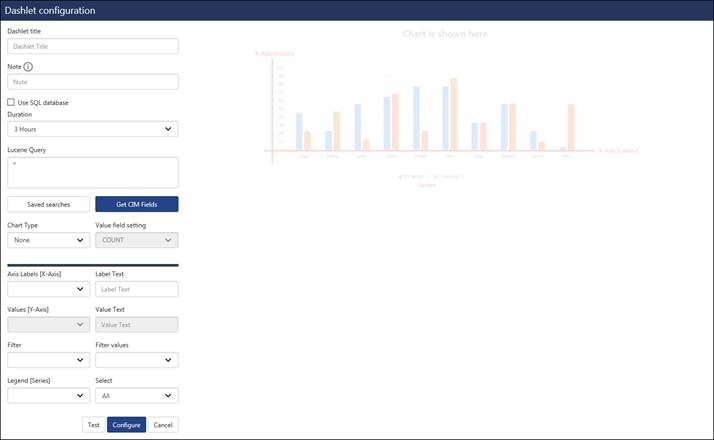
The Dashlet configuration page displays.
|
Field |
Implies |
|
Dashlet Title |
Enter the Dashlet Title |
|
Use SQL Database |
Check this if reports are to be fetched from Database. |
|
Lucene Query |
To create your own queries through its API and get the CIM fields. |
|
Chart type |
Select the graphical view option |
|
Value field settings |
Select from count/sum/average |
|
Axis labels (X-axis)/ Values (Y-axis) |
Plot the values from the dropdown options for the respective axis. |
|
As of |
Select the reports for Now/Recent. |
|
Filtered Values |
Select the values as per your requirement. |
|
Legend |
Select the series. |
The user can create widgets from the pre-defined saved searches available.
a. Click the Save searches button as highlighted in the figure above.
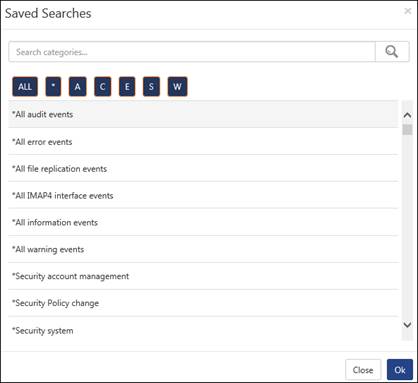
b. Select from the available list and then click OK.
c. Enter the required details and configure a widget for the selected saved search.
1) Enter the dashlet title, select the duration and click the Get CIM fields option.
It will populate the CIM fields as a dropdown for the available options.
For example: Axis Labels: X-Axis
2) Select the required fields from the available options and plot the graph for the widget.

3) Click the Test button.
Verify the changes and click the Configure button to create the widget.
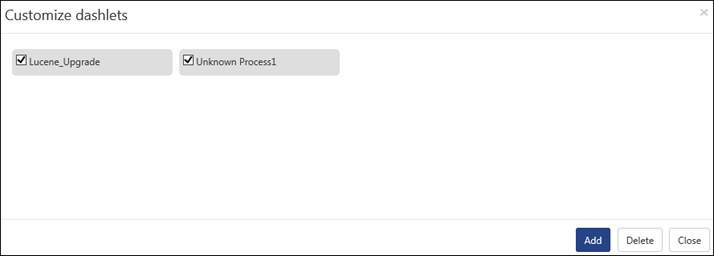
Now, for adding dashlets to the dashboard, click the customize icon![]() .
.
4) Select the configured widget and click the Add button.
It will get displayed in the Dashboard.
1) Dashlet Title : Flex Dashboard
The Use SQL Database option is checked.
2) Duration: 3 hours
3) Data source: Log Volume
4) Table: Both
5) Chart Type: Column
6) Axis labels (X-axis): Port
7) In Value field settings: select from count/sum/average.
NOTE: The Values (Y-Axis) is disabled for the Value Field Settings: Count.
The available values get displayed.
8) Click the Test button.
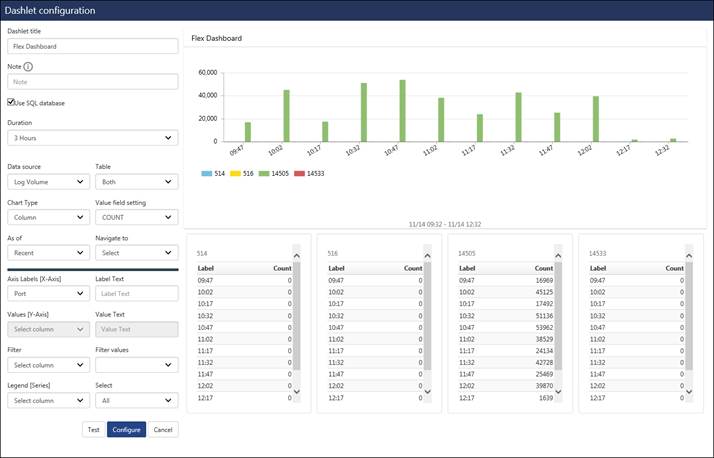
9) The Label with the counts gets displayed and the graph is also available.
10) After previewing the configured details, click the Configure button.
Now, for adding flex dashlets, click the customize icon![]() .
.
11) Select the configured widget and click the Add button.

The Dashlet gets added in your Dashboard tab titled as” Flex Dashboard”.

12) Click on the graph to view the refined data.
Similarly, you can plot graph for Chart Type: Line/Donut/Stacked and Meter gauge and add them to your custom dashboard.
NOTE: You can create multiple dashboards and can add Customized dashlets. You can even re-arrange the dashboards according to requirements.
For Example:
There are two machines where Linux agent is installed and it is forwarding samples every two seconds to the EventTracker. Now if the user wants to visualize Average Dist Queue length, following widget can be configured on the dashboard by selecting appropriate data source.
|
Chart Type |
Function |
X-Axis |
Y-Axis |
Legend |
|
Meter gauge |
Average( Default Select) |
N/A |
Avg. Disk queue length |
Computer |
The configured Dashlet can be exported to excel format.
1 Click the export icon.
2 Select the dashlets to be exported and click Export.

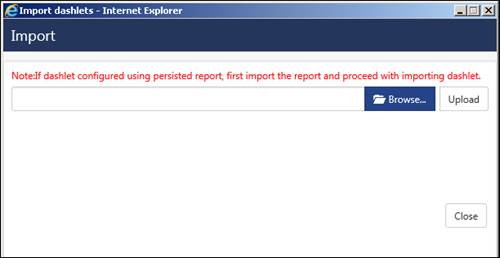
1. Click the Import icon. Browse the file and click on Import.
The dashlet gets imported.
For more information on the Dashlet configuration, click the info icon.
An IP address earns a negative reputation when it is found with suspicious activity, such as spam or viruses originating from that address. It is strongly recommended to perform a security audit on any of the systems that correspond to an IP address with a negative reputation, as those systems may have been compromised. Reputation score are measured from 0 to 100 and more the score more suspicious and dangerous it is.
Presently, EventTracker uses the services provided by IP Void, IBM XFE and Borderware to locate the Blacklisted IPs.
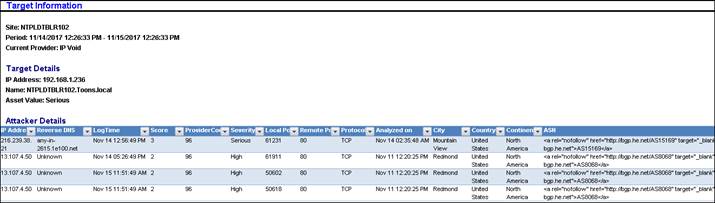
With the advent of the feature “Attackers” where the bad reputation IPs is pinned on the geolocation, it becomes necessary to display the information as to where these bad IPs have ventured in to the network. The targets feature will suffice the requirement, displaying those targets within the enterprise which are being attacked, along with the details like-How (Port/Protocol), By Whom (IP/Host Name) and When/ How often.
There are two different ways of looking at same pair table data. The user can view it from the attacker dashboard - "who is attacking/how/what port" or from the targets dashboard- "what is being attacked/by who/which port".
In both the cases, user plays the defender - job where he can protect the assets, react in a timely way and defend in a proper manner.
For Geo-location, EventTracker is using the IP Void and MaxMind GeoLite.
NOTE: Attackers Dashboard feature uses the following websites:
§ IP void (http://www.ipvoid.com/)
§ IBM XFE (https://xforce-api.mybluemix.net/)
§ Borderware (http://www.borderware.com/)
§ IP Info (http://ipinfo.io/)
§ GeoLite MaxMind (http://geolite.maxmind.com/download/geoip/database/GeoLite2-City.mmdb.gz)
The MaxMind Database will be downloaded on the first Wednesday of every month.
NOTE:
· To get data populated on the Attackers Dashboard, access needs to be provided for these websites. Make sure that the above URLs are excluded from firewall.
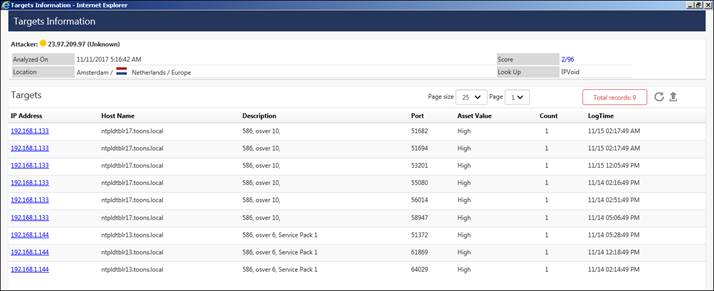
For viewing the targets that has been attacked, scroll down to the Targets pane, as shown in the figure below:
The Targets will be shown in the left pane and the Port Details will be shown in the right pane.
The targets will show the attacks happening on the systems in the form of a pair table. The left pane will list down the multiple targets with their asset value and host name (if any). The respective attackers will be listed down in the right pane along with the critical reputation information.
To view other information related to the attackers in the Target dashboard, navigate to the right pane and click the icon  .
.

The user can further perform a Log Search Pair/Log Search Target for a respective target.
The target information can further be saved in the excel formal by click the export icon  .
.
1. https://api.xforce.ibmcloud.com/
In Attackers,
2. https://exchange.xforce.ibmcloud.com/
5. https://rules.emergingthreats.net/
6. https://www.autoshun.org/files/
7. https://otx.alienvault.com/
8. https://www.senderbase.org/
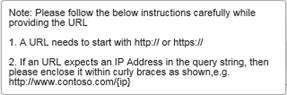
Please follow the below mentioned steps:
Ø Click the link: https://api.xforce.ibmcloud.com/doc/
Ø Expand the IP Reputation option.
Ø Click on GET /ipr/{IP}
Ø In theIP field, enter the IP Address, as shown in the figure below:
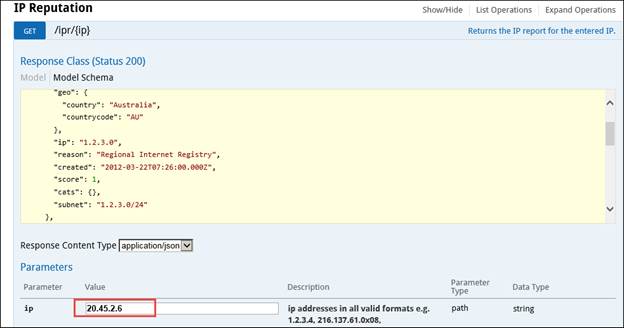
Ø Click the Try It Out! Button.
Ø Copy the URL ( Here: https://api.xforce.ibmcloud.com/)

Ø Now, open SQL Server Management Studio and Expand Databases.
Ø Expand EventTrackerData and then expand Tables.
Ø Select the IP_Provider_Engines table, right-click and select Edit Top 200 Rows.
Ø For IBM-XFE, replace the existing URL with the copied URL (Here: https://api.xforce.ibmcloud.com/)
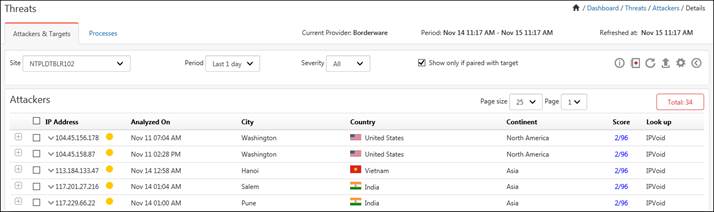
The Attackers Dashboard option helps to view the Top 20 geographic location pins. Each of these top 20 pins may contain ‘N’ number of bad IPs. The summary of the IPs can also be viewed in a Tabular format.
1) To view Attackers Dashboard, click the Dashboard icon and select Threats from the dropdown list.
Depending on the service provider selected in the Manager Configuration, the Attackers will be displayed.
|
2 NOTE |
|
The dashboard will populate data based on the default reputation service provider, i.e. Borderware. Once the user changes the service provider, the initial data will be intact and will continue populating data based on the new service provider, for the new IPs.
|
Enable the checkbox Show only if paired with target to display only the paired IPs in the dashboard.
Similarly, you can get information for IP paired with targets in a tabular format, by enabling the checkbox and selecting the Tabular icon![]() . This is shown in the figure below:
. This is shown in the figure below:
· Severity implies the threat level of the IP Addresses, where the severity is calculated on list. Click the Information icon ![]() to view the severity level of the different service providers.
to view the severity level of the different service providers.

· Select an IP address and click the add Casebook icon ![]() to add it to a New Casebook by selecting Add New or to an existing Casebook by selecting Add to Existing.
to add it to a New Casebook by selecting Add New or to an existing Casebook by selecting Add to Existing.
· Click the ![]() icon to refresh the dashboard.
icon to refresh the dashboard.
· Click the Export icon ![]() to export the details in a excel format.
to export the details in a excel format.
2. To get the information about the bad IP, click on the respective location, as shown in the figure below:
· For Service Provider: Borderware, the following information window will be displayed.

· For Service Provider: IBM XFE, the following information window will be displayed.

· For Service Provider: IP Void the following information window will be displayed.
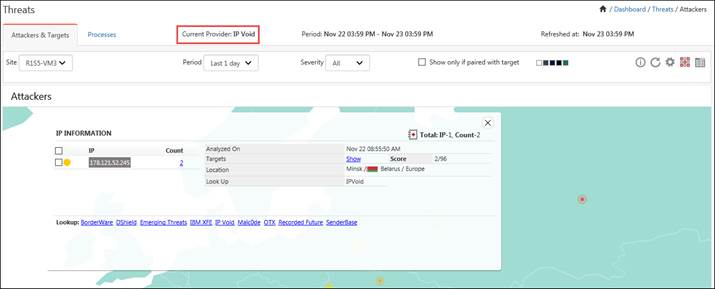
1. To view the targets for the respective attackers, click the Show hyperlink.
2. For more information on the IP, click on the respective Lookup provider hyperlink.
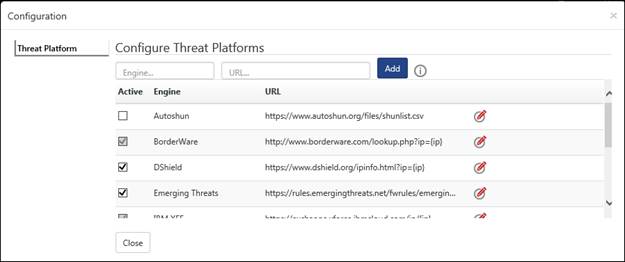
3. For IP Void, when the configuration icon![]() is selected, the following window is displayed.
is selected, the following window is displayed.
4. Click the Threat Platform option in the left pane.

· The user can add custom threat Intelligence platforms by adding the name in the Engine Box and URL name in the URL box and click the Add button.
· The user can also unselect checkbox from the engine list available.
· A pop up message displays. Click OK.
· For editing a particular Engine name or URL, click the edit icon![]() .
.
· For more information, click the information icon .
.
5. Click the Reputation option and the following screen will be displayed.

· For tracking the earlier list of IP Reputation, enter the number of days in the Check earlier than field and click the Save button.
6. For IBM XFE, when the configuration icon ![]() is selected, the following window gets displayed.
is selected, the following window gets displayed.
(For IBM XFE)
· The user can add custom threat Intelligence platforms by adding the name in the Engine Box and URL name in the URL box and click the Add button.
· The user can unselect checkbox from the engine list available.
A pop up message gets displayed. Click OK.
· For editing a particular Engine name or URL, click the edit icon![]() .
.
· For more information, click the information icon .
.
7. To get detailed information of the bad IPs, click the tabular view icon![]() in the Attackers dashboard. The IPs will be listed in a tabular format.
in the Attackers dashboard. The IPs will be listed in a tabular format.
8. Expand by clicking ![]() to view details about an IP.
to view details about an IP.
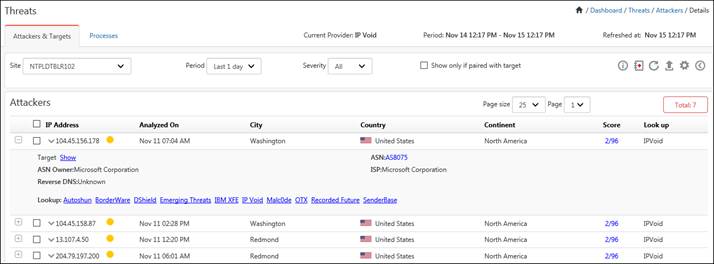
5. Click on the IP dropdown icon ![]() .
.
· Select the WHOIS option for more information on the IP.
· Select Log Search, for performing a search.
For Attackers >tabular data, the score column will get displayed along with DNS Block List and Lookup provider: Recorded Future. The figure is displayed below:

For viewing the targets that has been attacked, scroll down to the Targets pane, as shown in the figure below:
The Targets will be shown in the left pane and the Port Details will be shown in the right pane.

To view the Target data in details, click the icon .
.
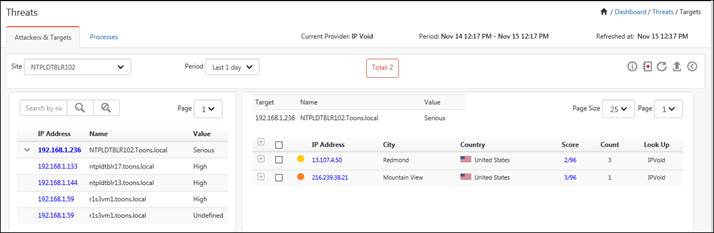
The targets will show the attacks happening on the systems in the form of a pair table. The left pane will list down the multiple targets with their asset value and host name (if any). The respective attackers will be listed down in the right pane along with the critical reputation information.
To view other information related to the attackers in the Target dashboard, navigate to the right pane and click the icon ![]() .
.

The user can further perform a Log Search Pair/Log Search Target for a respective target.
The target information can further be saved in the excel formal by click the export icon![]() .
.
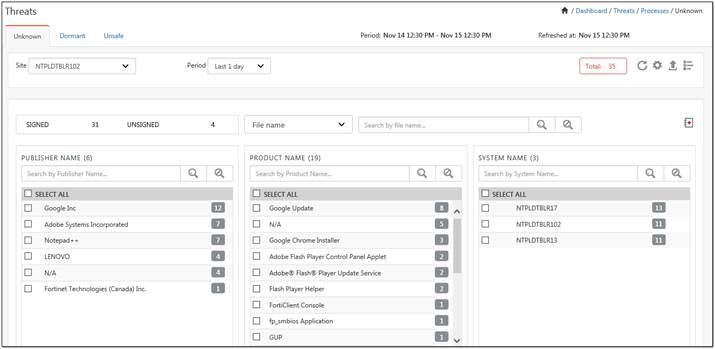
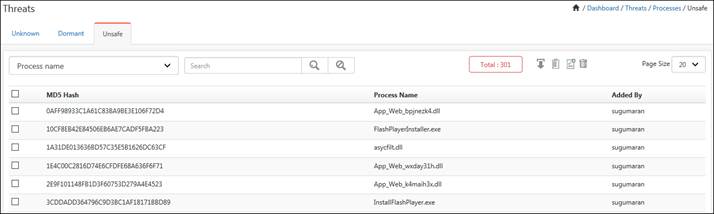
'Processes' is designed to interpret advanced threats and false positives which emerge within an enterprise. Whenever a new process is launched in a machine, it will look up for emerging threats, if any. The user will be able to filter the processes that are unknown based on Signature status. Also the user will be able to filter the processes that are not digitally signed for which he might be interested. He can also add the processes to Dormant/Unsafe list as per requirement.
2. http://hashlib.leic.lumension.com
3. https://exchange.xforce.ibmcloud.com
4. nsrl.eventtracker.com: 9120
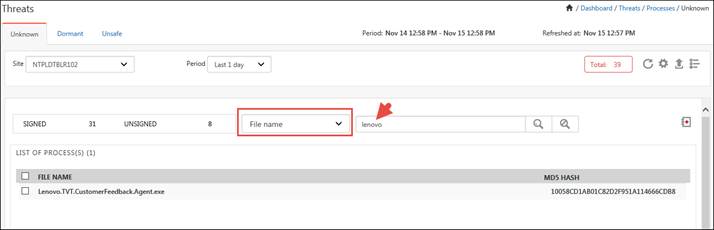
1. Navigate to the Processes tab.
The Process dashboard gets displayed with all the processes that are unknown.
NOTE:
1. The Processes dashboard is add on feature and is available only on certified license.
2. The executed processes are displayed in the unknown tab and the processes that are unexecuted get listed in the dormant tab.
|
Processes Dashboard |
|
|
Field |
Description |
|
Sites |
In a Collection Master, all sites are displayed. You cannot view this option in a Collection Point. |
|
Period |
Period can be selected for Last 1day/2day/3day/1 week/2 weeks/3 weeks/1 month/2 months/3 months/ All. |
|
Show |
The Executed/Non-Executed option can be selected to display the executed/Non-executed processes. |
|
Signed/Unsigned |
View the list of signed/unsigned status of the unknown process. |
|
Publisher name |
The name of the publisher will be displayed |
|
Product name
|
The name of the products will be displayed. |
|
System name |
The name of the systems will be displayed. |
2. Click the Casebook icon ![]() to add a process to a new Casebook or an existing Casebook.
to add a process to a new Casebook or an existing Casebook.
3. Use the Search icon![]() to search a Publisher Name/ Product Name/ System Name.
to search a Publisher Name/ Product Name/ System Name.
4. Use the Clear search criteria icon ![]() to clear the search.
to clear the search.
5. The user can select the refresh icon ![]() to refresh data.
to refresh data.
6. Click the export icon ![]() to get the list in excel format.
to get the list in excel format.
7. Click the Detail tab.
8. When the configuration icon ![]() is selected, the following window gets displayed.
is selected, the following window gets displayed.

· The user can add custom threat Intelligence platforms by adding the name in the Engine Box and Url name in the URL box and click the Add button.
· The user can also unselect checkbox from the engine list available.
· A pop up message displays. Click OK.
· Click the edit icon![]() for making changes in the URL or engine name.
for making changes in the URL or engine name.
· For more information, click the information icon![]() .
.
To reduce the noise in unknown process detection, the user can create and categorize a process as safe, based on the meta-data of the process. The user can create specific rules based on the attributes provided in Unknown Process filter wizard and can filter out the safe processes.
· To filter a process, click the icon ![]() in the Unknown process dashboard.
in the Unknown process dashboard.
The Unknown process filter wizard gets displayed.
|
2 NOTE |
|
By default, there are 9 Rules to filter out the EventTracker and Microsoft related files. These default rules help in reducing the noise.
|
· To add a new rule for filtering out a process, click the add rule icon![]() .
.


|
Unknown Process Filter |
|
|
Field |
Description |
|
Rule Name |
Give a rule name. |
|
Description |
Add an appropriate description. |
|
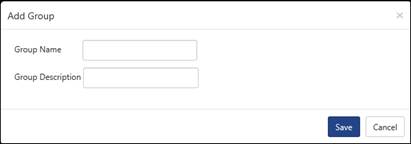
Add to Rule Group
|
Create group by clicking the add button
Click the Save button. To add rule to a group, click the dropdown list and select the group.
|
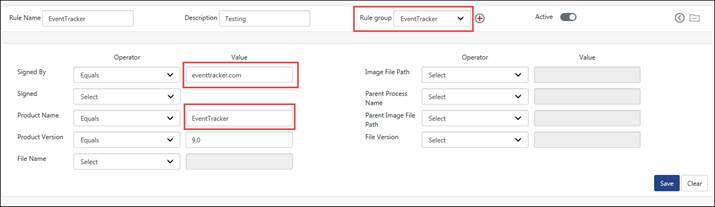
· Select any of the provided attributes (Publisher/Signed/Product Name/Product Version/File Name/Image File Path/Parent Process Name/Parent Image File Path/File Version) to create a rule and filter out a safe process.
For Example: The user is flooded with unknown processes (Signed/Unsigned), and he wants to filter out the signed product “EventTracker” which is published by “EventTracker “, as a safe process.
The user can create a rule based on the above mentioned criteria.
· Select the Rule Name as “EventTracker” and give a description.
· Select the relevant group from the dropdown list in the Add to Rule Group field.
· In Publisher: select operator (Equals/Contains/Regular Expression) from the drop down list and enter the publisher name.
· Here, we have selected “Equals”.
· Select the Signed field as “Yes”.
· Select the operator from the dropdown list and enter the product name. Here operator selected is “Equals”.
· After configuring the rule, click the Save button.
The figure is shown below:
The rule gets listed.
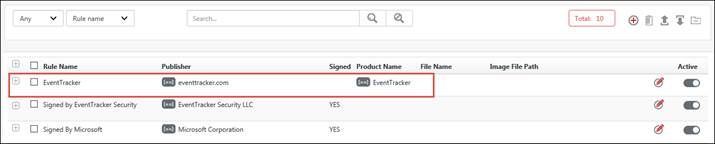
Once the rule gets activated, the processes related to the digitally signed product “EventTracker” of Publisher “EventTracker”, will be marked as safe and will not be displayed in the Unknown Process Dashboard.
· To edit the rule click edit icon ![]() and to de-active the rule, uncheck the Active box.
and to de-active the rule, uncheck the Active box.
· To export the rule click the export icon ![]() and to import rule click the import icon
and to import rule click the import icon![]() .
.
· To go back to the Unknown Process Dashboard, click the icon![]() .
.
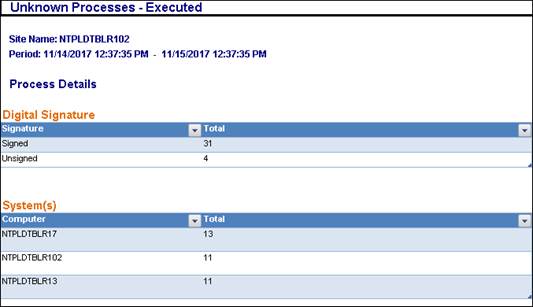
1. Click the SIGNED/ UNSIGNED hyperlink and it will list all the signed/unsigned unknown processes.
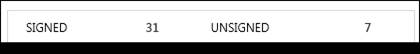

(Unsigned)
2. Get the process detail by selecting any Publisher Name. (For e.g. Google Inc.).

The Detail window will be displayed.
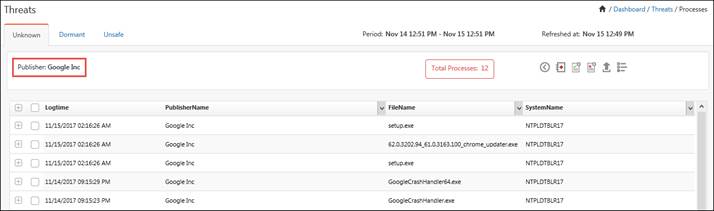
3. In the same way, the user can get the Process detail, selecting the desired Product Name or the System Name, in the Unknown process dashboard.
4. The user can also Sort and Filter the process as per requirement.

5. To export the details for selected file name, select it and then click the export icon![]() .
.
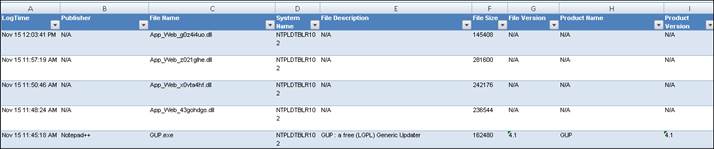
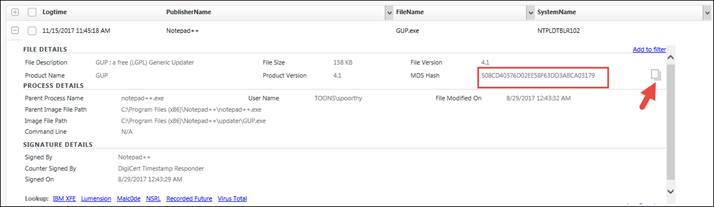
In the Process file detail window, expand a process.
The below figure will be displayed:

· Click the Log Search link, to perform a search.
· The users can also lookup for these unknown processes against the service providers i.e. IBM XFE/ Lumension / NSRL/ VirusTotal, etc. and by selecting the respective hyperlink. If the user is still not satisfied with the severity results for the process, he can use the unique MD5 Hash to search the severity of the process in some other Service provider.
File Name
· To search using the File name, select File name from the dropdown list and then enter the name of the file in the search box and click the search icon![]() .
.
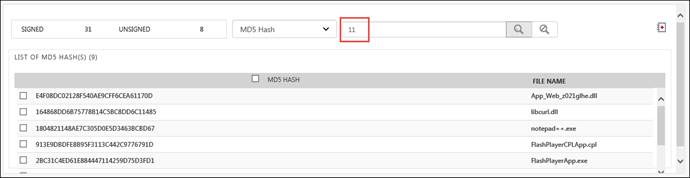
MD5 Hash
· Copy the MD5 Hash unique code by clicking the icon![]() .
.
· This is shown in the figure below:
· Now to perform a search using the MD5 hash, select MD 5 Hash from the drop down list and paste the unique code in the search box.
· Click the Search icon![]() .
.
The list will be displayed.

· The user can also simply type the random code details to perform a search.
· To add a process to the safe list, use the icon![]() .
.
It will get added in the safe list under the feature Active Watch List.
For e.g. If the user wants to move the “csc.exe” in to the safe list, select the checkbox and click the Add to safe list icon![]() .
.

The below message gets displayed:
· Go to Admin> Active Watch List.
· It will get added under the Safe list in Admin>Active Watch List.

· Click the move to unsafe icon ![]() to move it unsafe list.
to move it unsafe list.
· The Delete All icon![]() will delete all the processes.
will delete all the processes.
· To delete a process or multiple processes, select the processes and click the Delete icon![]() .
.
NOTE: The user can follow the same process to add a process or multiple processes to the unsafe list by clicking the Add to unsafe list icon .
.
To Import,
· Click the Import icon![]() .
.

· Browse the path and select the Import icon![]() .
.
NOTE: The file should be a valid CSV file containing MD5 Hash as first column and Process name as second column.
The dormant tab displays all the process which were not been executed.

The unsafe processes get listed in this page.
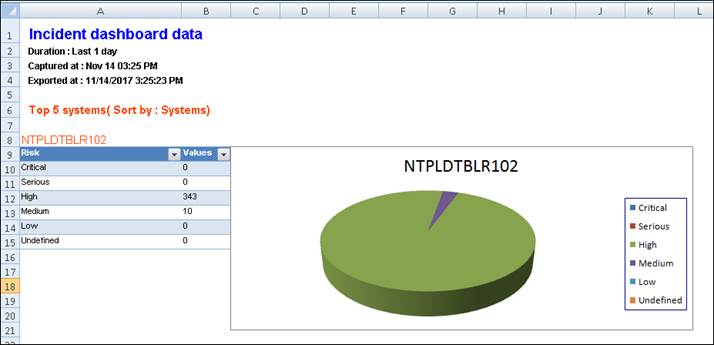
Incident dashboard helps you to interpret alert events received from managed systems. Internal scoring algorithm automatically computes and ranks alert severity levels. Only the most critical alerts that need to be attended first are displayed on the dashboard.
The Incidents Dashboard of a Collection Master (CM) now provides critical information about Collection Points (CP) also. You can sort the machines based on the Collection Points or Risk. By Default, Incidents Dashboard displays All Sites sorted based on Collection Points or Risk. It displays all the sites in which major incidents have occurred.
1 Log on to EventTracker , under Dashboard, select the Incidents option.
EventTracker displays the Incidents dashboard by default, containing both acknowledged and unacknowledged incidents. You can click on the graph and manage the generated incidents. By Default, Incidents Dashboard displays All Sites sorted based on Collection Points or Risk (By Default, Incidents Dashboard displays All Sites sorted by Risk in CM).
· You can sort the machines based on the Collection Points or Risk (We can sort by Risk/Sites in a CM and in the CP and standard by Risk/Systems)
· By default, EventTracker displays the incidents that are generated for past 24 hours in the Top 5 systems by Risk. (Top 5 sites by risk in the CM and top 5 systems by risk in the CP and Standard). It also displays the Incident for the last 7 days.
· In Top 5 incidents by count pane, it provides details about the incidents and number of times that particular incident had occurred.
· In Top 5 incidents by Risk pane, it provides details about the incidents that have been identified based on the severity (It is risks by count and can be classified as Critical, Serious, High, Medium, and Low).
· In Top 5 systems by Count pane, it shows details about the top 5 systems which have the highest number of incidents generated.
· In Incidents for last 7 days pane, a pictorial graph is displayed with information about the incidents that took place in last 1 week.
· If you click any graph, then Search Criteria window displays providing additional information which is explained in detail in the forthcoming section of this chapter.
· Now if you select any Collection Point or Collection Master node in Top 5 sites by risk pane, you can further drill down to view the incidents/alerts generated at the respective individual systems.
Collection Master

Collection Point
2 In a Collection Master, click  hyperlink and All sites is displayed.
3 To view systems by risk, click Sort by drop down, and then select Risk.
You can view sites by risk in a CM and in the CP it will be systems.
4 To view by systems, click Sort by drop down, and then select Sites.
You can view sites in a CM and in CP it will be systems.
5 To view the duration of incident details, click Duration drop down, and then select the required option.
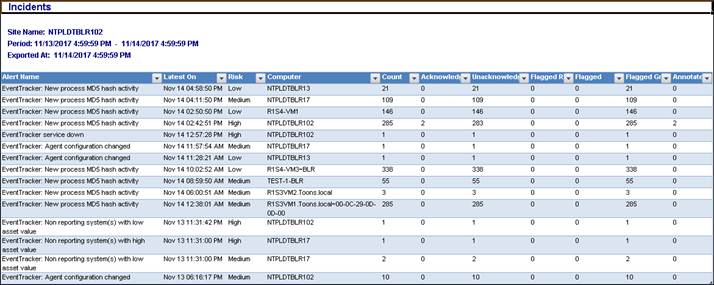
a. To view the summary of incidents dashboard in excel, click Export ![]() icon to export the data.
icon to export the data.
b. To view the file on local drive, click the Save button.
(OR)
To open the file directly, click the Open button.
A sample report is shown in the picture below.
1. Select Graph tab.
Collection Master
Collection Point
The graphical view pane will list the Top 5 unacknowledged incidents by Risk or Count. The pictorial representation can be viewed in donut, bar or stacked bar graph.
|
Incidents Dashboard – Graphical View |
|
|
Field |
Description |
|
Sites |
In a Collection Master, all sites are displayed. You cannot view this option in a Collection Point. |
|
Group |
In a Collection Point, enterprise system groups are listed in this drop-down list. By default, EventTracker selects the ALL option. NOTE: You cannot view this option in a Collection Master. |
|
View By |
View data by risk or count. |
|
Top |
By default, top 5 systems with more incidents are displayed in the top pane. You can select up to top 20 systems for displaying in the top pane. |
|
Acknowledged
|
Select this option to see the list of incidents that are acknowledged. By default, the dashboard displays only the unacknowledged incidents. |
2. Click on the graph to view detailed information.
Search Criteria window displays and details are explained in the forthcoming section.
1 To view the total incidents occurred on a particular system; click a graph in ‘Incidents’ or ‘Graph’ tab.
Search Incidents Window displays.

|
Field |
Description |
|
Date/Time |
Date and time on which the incident occurred. |
|
Incident # |
A unique number assigned for each generated incident. The Incident number will be in the form of YYYYMMXXXX, where YYYY represents the year, MM represents the month, and XXXX is the auto incremented number that will be reset to 1000 on the first day of every month. |
|
Risk |
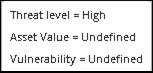
Move the pointer over risk value to view vulnerability scan summary and to identify incident risk in terms of threat level, asset value, and vulnerability value. For example:
When the vulnerability scanner(s) (ex: Nessus, Qualys) scans manager systems for vulnerability, EventTracker vulnerability parser parses the scan result file and displays the scan summary in a tooltip. This helps to quickly find the criticality of the vulnerability on the managed system(s). |
|
Event Id |
Event identifier associated with the generated alert. |
|
System |
The system name where the incident occurred. |
|
Log Type |
The event/incident recorded in the following logs i.e. Application, Security, System logs. |
|
Source |
The source of the event. This can be the name of a program, a system component, or an individual component of a large program. |
|
User |
The user name of the user that was logged on when the incident occurred. |
|
Description |
A brief description about the incident occurred. |
|
Ack status |
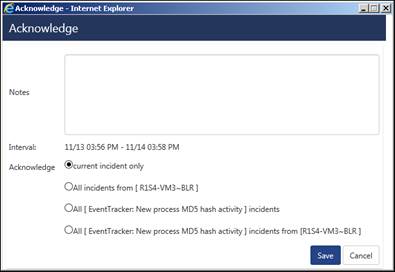
Check this option to acknowledge the incident. EventTracker opens Bulk Acknowledge window.
The incident(s) will be acknowledged for the selected Interval.
|
|
Add Notes |
a) Click Add Notes icon.
In Notes pane, write the comments about the particular alert or course of action taken on the alert, and then click the Ok button. Notes History pane will display the comments about the particular alert or action taken on the particular alert in the past. |
|
Email Incident |
Email an incident including current Notes and Ack status. Click Email icon .
Enter relevant data in To, Cc, Subject fields and then click Send. Configure the SMTP server settings to notify the incident via Email. To configure Email refer Manager -> Email Configuration. |
|
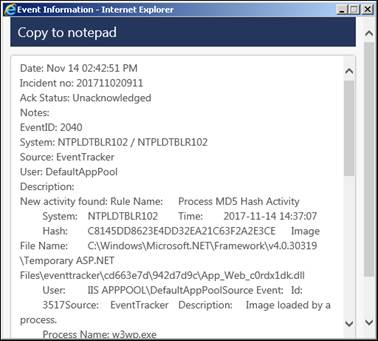
Copy to Notepad
|
Click Copy to notepad icon. Event Information window displays with Event details.
|
|
|
Click the icon to export the incident details in ‘Excel’ format. |
|
|
EventTracker :: Alert Configuration window displays. For detail information please refer Alerts |
|
|
Click Casebook icon to view data in Casebook. For detail information please refer Casebook. |
1. Select the Incident menu, and then select Tabular tab.
By default, EventTracker displays the unacknowledged incidents that are generated for past 24 hours. To view only the acknowledged incidents, select Acknowledged option from the drop-down box, as highlighted in the figure.
Collection Master
2. Click’ ![]() ’ symbol to view detail information i.e. Event Id, Source, Event Type, Description.
’ symbol to view detail information i.e. Event Id, Source, Event Type, Description.
3. Click Flag  icon to change the status of the incident.
|
Flag icon |
Description |
|
|
No action has been taken |
|
|
Relevant action is required for that particular incident to solve an issue |
|
|
Checked the incident and necessary action has been taken care of. |
4. To acknowledge all incidents that have occurred, click Ack checkbox for the particular incident and then the Ack button.
This feature acknowledges the incidents present only in the same page.
Bulk Acknowledge window displays.
5. Enter comments and then select the Save button.
6. To view the incidents that have been acknowledged, select the Acknowledged option from the drop down box.
All the acknowledged incidents will be visible in Tabular View by selecting the Acknowledged option.

7. Click Add Notes ![]() icon to add comments about a particular incident.
icon to add comments about a particular incident.
8. Click Email  icon to mail an incident.
9. Click Casebook![]() icon to update data in Log Book.
icon to update data in Log Book.
A Casebook message displays.

10. To add a new Casebook entry, click the Add new button.
11. To add to an existing Casebook, click the Add to existing button.
Log Book window displays.

12. Enter/Modify the required data, and then click the Save button.
For detailed information about Casebook, refer Casebook.
‘Log Search’ feature is added to search for logs pertaining to the System or Event Id. The results obtained can further be refined.
1 In Tabular tab, click the Event Id or System dropdown in the bottom pane, select Log Search.
· Log Search for a System will display all the events related to that particular system.
· Log Search for an Event ID will display the results for the selected Event Id and the system name where the event was generated.
For more information on log search, refer Log Search document.
|
2 NOTE |
|
In a collection master UI Tabular view, Log Search will not be shown for collection points. For detail information on Alert configuration, refer Alerts. |
A) Click Knowledge Base option to view event details in the ‘EventTracker Knowledge Base’ Web site.
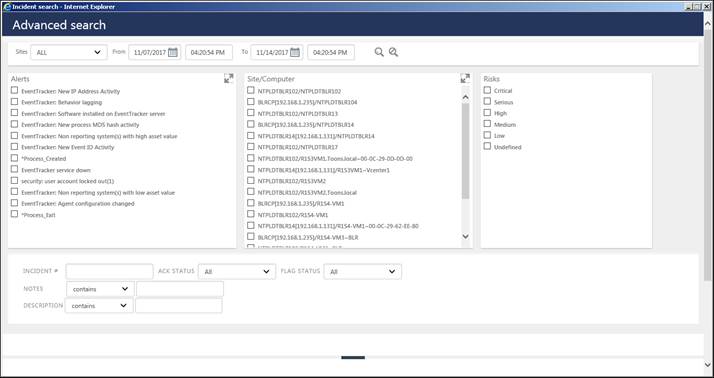
1. Click Advanced Search icon 
Advanced Search window displays.
Collection Master

Collection Point
2. In Collection Master Advanced Search pane, select the required Sites from drop down.
The Sites option is not available in a Collection Point.
3. Select / enter the required Alert, Site/System, Risk, Incident#, Ack status, Flag Status, Notes, Description fields.
4. If you want to grill down the search criteria, select Contains/ does not contain from Notes drop down and enter the note to list.
5. If you want to grill down the search criteria, select Contains/ does not contain from Description drop down and enter the description to list.
6. In Duration pane, enter From: and To: date fields.
7. Click the Search button.
8. To clear the search criteria, click ![]() icon.
icon.
9. To acknowledge all incidents that have occurred, click Ack hyperlink.
This feature acknowledges the incidents present only in the same page.
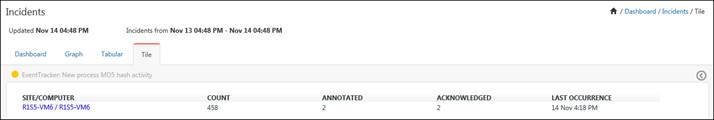
To make the Incidents feature more interactive, EventTracker now introduces a new dashboard named Tile Dashboard. This dashboard will help the user in getting the minute information related to the alert in a more precise way.
This new feature is provided to view the “Alert detail” in a tile format. This will show the number of “Incidents” generated for that “Alert”, last occurred time of an incident, severity and number of actions taken for that alert, acknowledged/unacknowledged/Flagged and number of annotated count.
Information will also be displayed for List, Trend (for 24 hrs) and E-mail Incident/Tune Alert Settings, by clicking the respective icons available.
How is it Helpful?
1. Easily identify the Alert’s and its details in a Tile view.
2. Add all the Event(s) to Log book at a time.
3. Identify and view the type of action taken for the particular Alert.
4. Fine Tune the Alert and its details at a click.
5. Trend graph option to view the basic level details.
How it works?
· Login to EventTracker and navigate to Incidents in the Menu Bar.
· From the dropdown options, select Tile View.
The Tile Dashboard gets displayed. It will show the data available in the Tabular options in a Tile format.

Collection Master (Console)
NOTE: In Collection Master, any Collection Point selected from the Site: dropdown will not display the Alert Action icon  and the Tune Alert settings option on the Tools icon
![]() .
.
Collection Point (Site)

F
Collection Point (Console)
|
Incidents Dashboard – Tile View |
|
|
Field |
Description |
|
Sites |
In a Collection Master, all sites are displayed. You cannot view this option in a Collection Point. |
|
Group |
In a Collection Point, enterprise system groups are listed in this drop-down list. By default, EventTracker selects the ALL option. NOTE: You cannot view this option in a Collection Master. |
|
Sort By |
View data by risk or time. |
|
Top |
By default, top 5 alerts with more incidents are displayed in the pane. You can select up to top 20 alerts for displaying in the top pane. |
Click the respective icons for more information. The figure is displayed below:
· Click the systems icon  to view the systems where occurred.
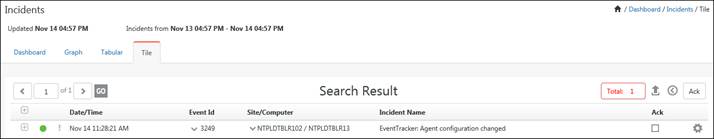
· Click the system hyperlink and it will redirect you to the search result.
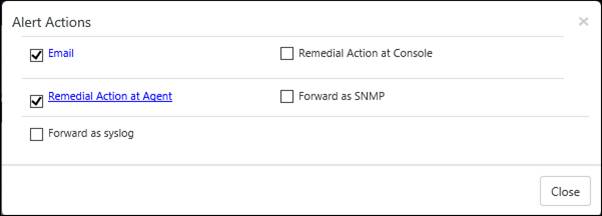
· Click the notification icon  to view the alert action taken.
NOTE: The configured alert actions will display as a hyperlink and will be checked. The figure is shown below:
· To view the search list of the incident, click the list icon .
.
· The user can further click the tool icon ![]() for a particular incident and select any of the dropdown options displayed in the figure below:
for a particular incident and select any of the dropdown options displayed in the figure below:

In the Tile Dashboard,
· Click the trend graph icon , to view the incidents for the last 24 hrs.
· To e-mail the incident, click the icon ![]() and select E-mail Incident option from the dropdown list.
and select E-mail Incident option from the dropdown list.
· To tune the alert settings, select the Tune alert settings.
To view the status of the incident,
· Click  icon to view the acknowledged incident(s).
· This ![]() icon displays the count of the annotated incidents. Annotated incidents here means the incidents where comments were been added.
icon displays the count of the annotated incidents. Annotated incidents here means the incidents where comments were been added.
· The Flag Red icon  and Flag Green icon
 ![]() shows the respective counts for the same.
shows the respective counts for the same.
To view all the Alert details in an excel format, click the ![]() icon.
icon.
If total incident count is equal to the acknowledged count then tile will be flipped informing that this tile is of least importance.
A user visiting Tiles dashboard will be interested to know incidents which are important to him and needs attention. In the current scenario, such incident might be scattered and difficult to find. Tile Flip for those tile(s) will make the process hassle-free so that other incidents get noticed.
NOTE: The auto refresh time for tiles is set to 120 seconds, by default.
Manually reviewing and analyzing enterprise wide event log data to identify patterns of suspicious activity is a time consuming and tedious task, which leaves ample room for errors and missed conditions. To reliably get the right information, jobs must be defined for anomalous conditions - and these are only as good as the person writing the jobs/performing the review. In addition, you must know what you are looking for to write the jobs.
EventTracker addresses this issue with its Machine Learning Activity, a dashboard that automatically provides information about unusual activity by:
n Continuously monitoring the event log stream
n Performing a combination of statistical and Machine Learning
n Detecting both new activity and activities that significantly deviate from normal operations
Conditions detected include:
n Abnormally high or low admin and user activity
n Abnormally high or low system, process or IP activity
n First seen for IP addresses, admins, users, processes etc.
n Sudden changes in event volumes
EventTracker’s Machine Learning provides you dashlets with the predefined set of job and allows you to add custom dashlets created with your own job set. It is left to your discretion to organize the dashlets as per your requirement. The security and operational activities of an enterprise are presented in graphical form in this dashboard. By Default, EventTracker displays the last 24-hour data.
The Machine Learning dashboard can be configured to display data across sites (i.e. Collection Points reporting to Collection Master) i.e. it is possible to view data in Collection Master for individual Collection Points, if configured. CP sends Machine Learning analysis data periodically to CM every 10 minutes and the CM stores the data for each CP.
|
2 NOTE |
|
A job is a set of rules based on which new activities and Anomalies are identified in an Environment. |
|
Machine Learning |
Windows Audit Policy and Acct Mgt |
|
Windows Applications |
|
|
Event ID |
|
|
IP Address |
|
|
Windows Logon Failure |
|
|
Windows Network |
|
|
Windows Process |
|
|
Windows RunAway Process |
|
|
Windows Software Install |
|
|
System |
|
|
USB |
|
|
Windows Logon |
|
|
Windows Interactive Logon Activities |
|
|
Windows User Location Affinity |
|
|
Unique Process Hash |
|
2 NOTE |
|
The Dashlets are not refreshed automatically. Click on the Refresh
|
This option helps to add dashlets to view Machine Learning Activity. Machine Learning dashboard displays machine activities through default dashlets. Using Customize option the Machine Learning dashlets can be added to the dashboard. Also new Machine Learning dashlet can be added by creating custom Machine Learning Jobs.
1 Navigate to Dashboard icon and select “Machine Learning”.
EventTracker displays the Machine Learning dashboard with default dashlets.
2 Select Activities for drop down and select the required number of days.
The data will be displayed as per the number of days selected. This option helps in viewing activity for specified duration.
NOTE: The activities for number of days depend on Purge Frequency set in Machine Learning Settings i.e.
a. Click the Admin dropdown, select Machine Learning Settings.
b. In Purge Frequency pane, select Purge user data older than option, select number of days from the drop down, and then select the OK button.
3 In the dashboard, click the icon ![]() in the right hand side corner to customize the dashlet.
in the right hand side corner to customize the dashlet.
![]()
EventTracker displays the Available Dashlets dialog box.
4 Check the required activity option, and then click Add.
EventTracker adds the selected dashlets to the dashboard.
Important To Know
n Move the mouse pointer over a donut or the legend to view tooltip.
n Click a donut or legend.
n EventTracker moves you through Model Activity Dashboard.
5 Click the corresponding Donut/Bar/Stacked Bar graph.
EventTracker displays the respective Model Details page.
Ex: Window Network.
First pane Activities for displays activity details and weekly trend of activities.
Second pane Activities for Process Name displays top five Network Processes.
Third pane Anomalies in user occurrence displays anomalous activities, helps to monitor abnormal user activities”
Fourth pane New Process Name observed displays process activities.
Left pane displays the list of Extracted value based on the configured Machine Learning Jobs.
A. Click a hyperlink in the alphabetical list.
(OR)
Type the search phrase in the search field, and then click Search ![]() icon
icon
EventTracker displays the list of searched criteria.
To do a Log Search, move the mouse pointer over a field in Process Name column/IP Address. From the drop down, click Log Search.
For more details regarding Log Search, refer Log Search.
A. To filter or ignore activities for the specified entity, select Add to filter list.

Filter list window displays.

B. Select the required option and then click the Save button.
This option helps to reset the dashboard with default dashlets.
1 In Machine Learning dashboard, click the Reset personalization icon.
![]()
EventTracker displays the confirmation message box.
2 Click OK to reset the dashboard.
EventTracker removes the custom dashboard that you have added.
This option provides a summary of total machine learning activities, which provides the distinct count of the activities and the total count of its occurrences. Machine Learning Volume analysis helps to analyze machine learning activity log volume.
1 In the Machine Learning dashboard, click the icon  to select Machine Learning Volume Analysis option.
![]()
EventTracker displays the Machine Learning Volume Analysis dialog box.
|
Field |
Description |
|
MACHINE LEARNING |
List of activities. Click Machine Learning to sort the list in ascending or descending order. |
|
UNIQUE |
Count of unique activities. |
|
TOTAL COUNT |
Total count of occurrences with respect to unique activities. |
2 Click the required activity hyperlink to search the selected activity within a specified time range.
3 Select Event ID options, set appropriate time range, and then click Generate.
EventTracker displays the consolidated list of activities.

4 Click the Print hyperlink to print the report.
Windows Logon
|
Windows 7/8/2008/2012 Systems |
|
4624, 4625, 4634, 4647, 4738, 4740, 4768, 4771, 4772, 4778, and 4779 |
Windows Audit Policy and Acct Mgt
1. Click Windows Logon / Windows Audit Policy and Acct Mgt donut chart to view the details.
(OR)
Click the corresponding Donut/Bar/Stacked Bar graph.
EventTracker displays the respective Model Explorer page.
(OR)
In Job Name drop down, select Windows Logon / Windows Audit Policy and Acct Mgt.

This option helps you analyze Application activity.
1. Event ID considered under this activity is 3221. To analyze Windows Applications, click donut chart to view application activity details per system.

(OR)
From Job Name dropdown, selectWindows Applications option, and then click  icon.
icon.
EventTracker displays the respective Model Explorer page.
This option helps you analyze events by occurrence.
1. To analyze events by occurrences, click the Event ID donut chart to view per event activity details.

(OR)
From Job Name dropdown, select Event ID option, and then click  icon.
icon.
EventTracker displays the “Model Explorer page” page.
This option helps you analyze per IP trend of events.
IP address is extracted from the Event Description. If the extracted string matches the loopback address ‘127.0.0.1’ or local system IP ‘0.0.0.0’ then it is filtered out. Otherwise, it is considered as a valid IP address.
1 Click the IP Address donut to view Model Explorer details for IP address activities.
(OR)
From Job Name dropdown, select IP Address option and then click  icon.
icon.
EventTracker displays the respective Model Explorer page.
By default, IP Class dropdown displays all IP addresses.

2 To view only Private or Public IP addresses, click the IP Class drop-down and then select Private or Public respectively.
3 To do a Log Search, move the mouse pointer over a row on the left pane or a row in the third and fourth panes. From the drop-down list, click Log Search.
EventTracker opens the Log Search browser with query results.
4 Click Classification ![]() icon.
icon.
All private IP addresses are displayed. You can also enter IP address in CIDR format which is explained below. Refer Filter List section.

5 Select any private IP address and then click Update.

6 Click List Lookup ![]() icon to monitor unknown/blacklisted IP addresses that have logged into the network.
icon to monitor unknown/blacklisted IP addresses that have logged into the network.
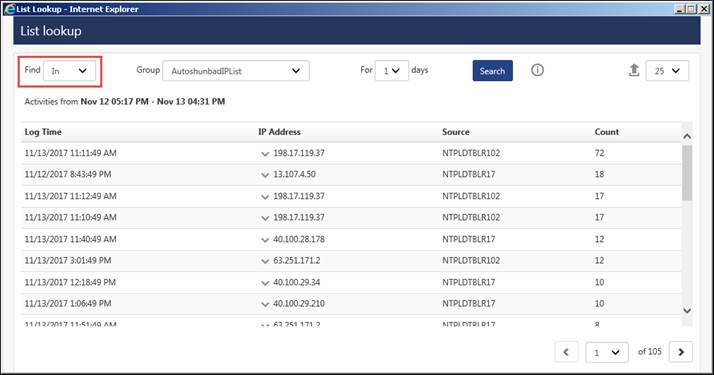
This list is generated from Active Watch List. Refer Admin menu -> Active Watch List.
If you select ‘In’ from Find: drop down, the processes that are found in Active Watch List group displays.
7 Click Information ![]() icon to view detail information.
icon to view detail information.
8 To view IP Addresses that are not available in Active Watch List, select Not in from Find: drop down.

If you select ‘Not in’, the processes that are NOT available in Active Watch List group display.
9 Click the IP address dropdown in the left pane/ third pane/ fourth pane / List Lookup, and then select Whois.
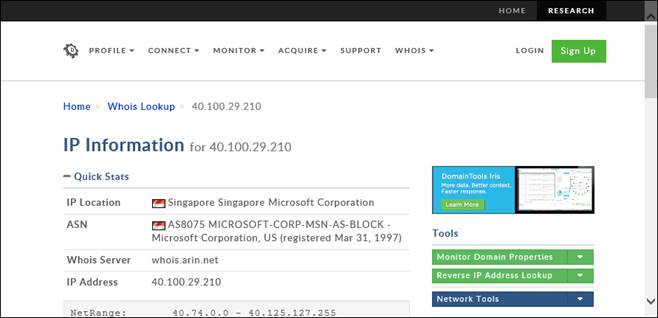
Whois option is provided to resolve WAN IP addresses and to know the owner details.
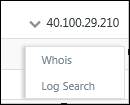
EventTracker moves you through the ‘DomainTools’ Web site.
1. Click the Filter ![]() icon.
icon.
Filter List window displays.

2. Click the Add button.
Job filter pane displays.
You now have an option to enter IP address in CIDR (Classless Inter-Domain Routing) format also. Ex: 12.56.1.2/10.
CIDR is a way to allocate and specify the Internet addresses used in inter-domain routing more flexibly than with the original system of Internet Protocol (IP) address classes.
The number of addresses of a subnet defined by the mask or prefix can be calculated as 2address size - prefix size, in which the address size is 128 for IPv6 and 32 for IPv4. For example, in IPv4, a prefix size of /29 gives: 210-2 = 28 = 256 addresses.
3. To exclude a IP address from being monitored in Filter list pane, select Exclude for all uses or Exclude from view only option.
4. In Filter list pane, enter the required IP Address in the box and then select the Save button.
Ex: In our example to exclude 12.56.1.2/10 from being monitored, enter this IP address and then click Save. Hence the activities of IP address 12.56.1.2/10 will be completely ignored.

5. Click the Activate button.
This option helps you analyze network activities.
Event ID’s considered under this activity are 3512 and 3513. Whenever 3512 and 3513 events are received, remote IP address and remote port information is extracted from the event, and its count is maintained.
1 Click Windows Network donut chart to view activity details of devices like printers, routers over the respective network.
(OR)
From Job Name dropdown, select Windows Network option, and then click ![]() icon.
icon.
EventTracker displays the respective Model Explorer page.
This option helps you analyze per user per system process utilization.
Event IDs 592 (non-Vista systems) and 4688 (Vista systems) are considered for process activity. Information like process name, process id, user name, domain name, and computer name are extracted from the ‘Event Description’.
1. To analyze process by occurrence, click the Windows Process donut chart to view process utilization activities details.
(OR)
From Job Name dropdown, select Windows Process option, and then click ![]() icon.
icon.
EventTracker displays the respective Model Explorer page.
2. Click ListLookup ![]() icon to view malicious processes that can harm the system.
icon to view malicious processes that can harm the system.
ListLookup window displays.
3. In Find: drop down, select In or Not in, select the required Group: and duration.
If you select ‘In’, the processes that are found in Active Watch List group displays.
4. Select the Search button.

5. Click Information ![]() icon to view additional information.
icon to view additional information.
6. In Find: drop down, select Not In, select the required Group: and the duration.
If you select ‘Not in’, the processes that are NOT available in Active Watch List group display.
7. Select the Search button.

8. Click Process drop down.

9. To perform a search, click Log Search link.
10. To know more details about a process, click What is this? Link.
You will be redirected to the link http://www.processlibrary.com/ automatically.
11. To filter any process from the list, click Add to filter list link.
This list is generated from Active Watch List. For detail information refer Admin menu -> Active Watch List.
This option helps you analyze runaway processes.
Event IDs considered under this activity are 3217 and 3218.
Whenever 3217 and 3218 events are received, process and system names are extracted and its count is maintained. Left pane would list the process names and right pane would list two counts for that process, one for high memory usage and one for high CPU usage.
1 To analyze Runaway process activity, click Windows Runaway Process donut chart to view per runaway process activity details.

(OR)
From Job Name dropdown, select Windows Runaway Process option, and then click the ![]() icon.
icon.
EventTracker displays the respective Model Explorer page.
This option helps you analyze activities occurred at systems. System name is extracted from ‘Event Properties’.
1. Click the System donut chart to view the details of system in an enterprise.
(OR)
From Job Name dropdown, select Software option, and then click the ![]() icon.
icon.
EventTracker displays the respective Model Explorer page.
EventTracker provides advanced monitoring and analysis of the usage of these devices including:
n Tracking Insert/Removal
n Recording all activity (file writes to)
n Disabling according to predefined policy
With EventTracker, you can, for example:
n Set a policy that permits only certain devices to be used on servers
n Continuously monitor all USB usage on workstations
n Alert in real-time on the insertion of devices
n Block a specific device, if necessary
n Record all files that a user is writing to the USB
Included in the EventTracker Reports Engine are pre-packaged reports that can display all USB activity, including:
n Who the user was,
n What type of device was used
n What files were copied to the device
A complete inventory is captured that can be used for real-time analysis as well as a powerful forensic tool.
For more information, refer the System Monitor section.
This dashboard will display data for 2 types of Logon in Windows Logon.
· RDP (Remote Desktop Users) – Logon Type 10
· Interactive Users – Logon Type 2
The graphical representation can be viewed by them in Machine Learning Dashboard which is similar to Incidents Dashboard.
1. Event ID considered under this activity is 4624. To analyze events, click the Windows Interactive Logon Activity pie chart to view per event activity details.

(OR)
From Job Name dropdown, select Windows Interactive Logon Activity option, and then click Go ![]() icon.
icon.
EventTracker displays the respective Model Explorer page.
|
2 NOTE |
|
This will not be visible for users of other Logon Types. |
This dashboard will display all windows interactive logon related events along with the pattern that occurs on any domain controller or windows machine in the network.
NOTE: The dashlet will support 2003, 2008, 2012 and 2016 domains.
The graphical representation can be viewed by them in Machine Learning Dashboard which is similar to Incidents Dashboard.
1. To analyze events, click the Windows user location affinity donut graph to view per event activity details.
NOTE: This Machine Learning Job will only get displayed in the dropdown list of dashboard, when the user enables the display in dashboard option by editing the rule under Machine Learning Job.

(OR)
From Job Name dropdown, select Windows user location affinity option, and then click Go ![]() icon.
icon.
EventTracker displays the respective Model Explorer page.
Change auditing is the way to monitor voluntary and involuntary changes on your system and to make sure that your system has not been compromised. Ultimately, it helps to detect and recover from the most insidious of system compromises.
Change Audit dashboard works/possess similar features like Operations/Security Dashboard. It allows you to add Dashlets to view Unauthorized Changes, Unauthorized Changes History, Change By Object Type, and Change By Change Type.
I. Log on to EventTracker Enterprise.
II. Click Dashboard icon and then select Change Audit.

EventTracker displays the Change Audit Dashboard.

III. Click the Customize ![]() icon.
icon.
EventTracker displays the Change Audit Dashlets pop-up window.

IV. Click Edit to edit the Title or Time Interval settings, and then click Update.
V. Select the required Change Audit Dashlets and then click Add.
EventTracker displays the Dashboard with newly added Dashlet(s).
VI. Click any graph or a legend to view respective Dashlet summary.

VII. Click any hyperlink to view respective change details.
VIII. Select Access History.

Access History flex report displays.

IX. Click Export icon to export data to excel.
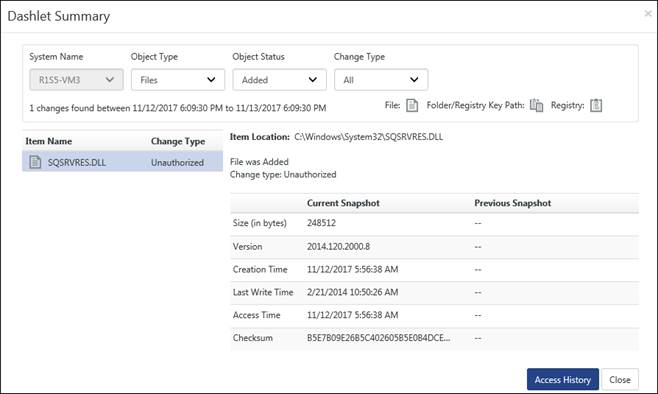
Last changes display the summary of snapshot comparison results.
a. Click Last changes tab.
EventTracker displays the Last changes tab.

By default, EventTracker displays chart view summary of Authorized, Unauthorized, Configuration, and Business Knowledge Change Types for all managed systems irrespective of the system groups.
“No data available” implies that no change has been detected for the default Change Types when the last snapshot was taken.
b. Click any graph to view Change Details. Click Group by Path to sort the Item Name by path.
|
Fields |
Description |
|
Unauthorized |
Detected changes that cannot be matched to an approved change request. |
|
Configuration |
Configuration audit helps to track all changes that have been made to a computer configuration, or to be able to restore the configuration of that computer back to a known valid restore point. |
|
Business Knowledge |
Is the concept in which an enterprise consciously and comprehensively gathers, organizes, shares, and analyzes its knowledge in terms of resources, documents, and people skills. |
A. In the View Type dropdown, click Data.
B. In the View By dropdown, click Change Type/Object Type.
EventTracker displays the statistical data of Change Type/Object Type.

a) In the View Type dropdown, click the Graph option.
b) In the View By dropdown, click Change Type/Object type.
EventTracker displays the default chart view summary of Change Type/Object Type.
To set Dashboard preferences, refer EventTracker Control Panel -> Change Audit.
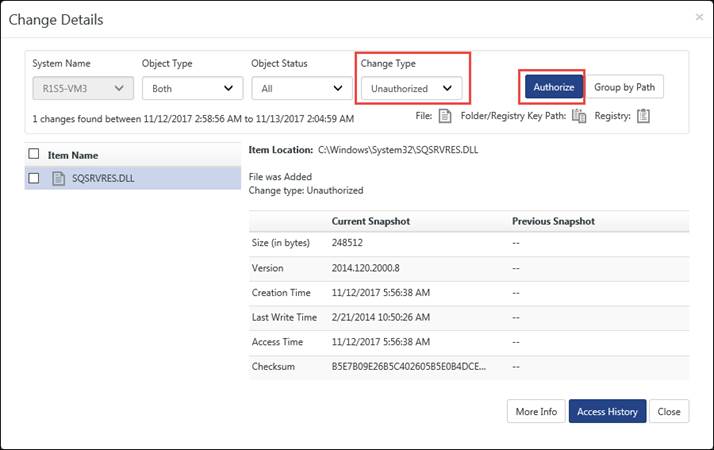
1. To authorize unauthorized changes, click the Last Changes tab.
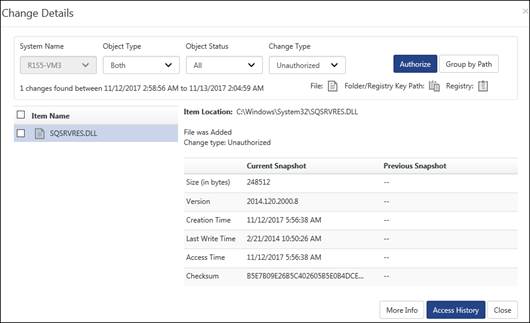
2. Click the hyperlink under the respective columns under View Type - Data or click on the donut section under View Type - Graph.
EventTracker displays the Change Details pop-up window.
3. Select the change type as Unauthorized from the Change Type dropdown.
4. Select the required checkbox against the Item name to authorize.
5. Click the Authorize button.
EventTracker displays the Authorization comment window.

6. Type the reason why the selected item needs authorization in the Authorization comment field for future reference.
This field is not mandatory.
7. Click Save.
EventTracker displays the confirmation message pop-up window.
8. Click OK to save changes.
EventTracker authorizes the selected item and removes from the unauthorized list.
You can also authorize items by grouping them based on a common location.
9. Click Group by Path to view items by location.
EventTracker displays the Group by Path window.
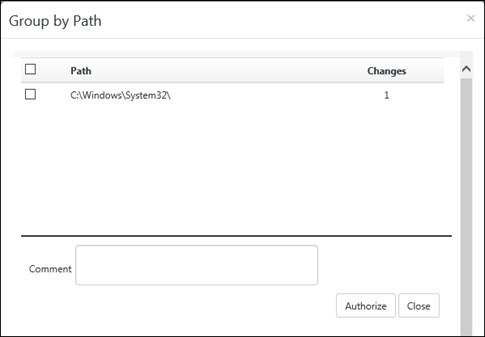
10. If there are multiple paths displayed and you wish to select all paths, select the checkbox against Path, and then click the Authorize button to authorize all the items.
(OR)
To select individual path, select the checkbox for respective path, and then click the Authorize button.
|
2 NOTE |
|
EventTracker enables Authorize button only for unauthorized items. EventTracker displays the “Authorize” button when changes to “Unauthorized” items (*.exe, *.ocx, *.dll, *.sys, *.drv, *.msc, *.cpl, and *.vxd) are detected. EventTracker displays the “More Info” button when new/modified/deleted DLLs and EXEs are detected.
|
This option helps you view access history of files, folders, and registry keys in a chronological order.
|
2 NOTE |
|
It is mandatory to enable Windows Object Access auditing on the target system prior to using this feature. For more details, refer Enable OS Auditing on folder(s) . |
1 Select an Item Name and then click Access History.
EventTracker displays the progress bar.
EventTracker displays the access history of the selected item in a pop-up window.
2 Click Export to export the report into Excel format.
1 Select an Item Name and then click More Info.
EventTracker redirects to http://www.processlibrary.com Web site.
1. Right-click the folder that you want to audit, select Properties.
Example: \\<system name>\Program Files\Prism Microsystems\EventTracker\Cache
2. Click the Security tab on the Properties window.

3. Click Advanced, and then click Auditing tab on the Advanced Security Settings window.
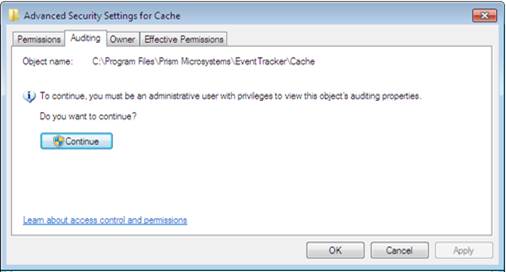
4. Click Continue.
Advance Security Settings for Cache window displays.
5. Click Add.
Select User, Computer, Service Account, or Group window is displays.
6. To select the location from where you want to add users, click Locations.
7. Select the location from the Locations window and then click OK.
8. Enter the user name in the Enter the object name to select field.
Example: Everyone

9. Click Check Names.
If the user name is valid, the user name is displayed in the Enter the object name to select field. Otherwise, an error message is displayed.
10. Click OK.
Auditing Entry for window is displayed.
11. Select Full Control under Successful and Failed.
12. All other checkboxes are also selected automatically when you select Full Control checkbox.
|
2 NOTE |
|
Select the Access options as per your requirement. |
13. Click OK.
Advanced Security Settings for Cache window, displays with the newly added user.

14. Click Apply, and then click OK.
|
2 NOTE |
|
Similarly, you can enable auditing on files. |
Policy Dashboards helps to add Dashlets to view the compliance status of systems against which the Policies were compared.
1) In Policy Dashboard tab, click Configure icon![]() .
.

EventTracker displays the Configure Benchmark Dashlets pop-up window.
2) Type a comprehensible name in the Display Name field.
3) Select a policy from the Policy Name field.
EventTracker displays the Configure Benchmark Dashlet pop-up window with Schedule details of the selected Policy.

4) Click the checkbox to select the Schedule(s), and then click the Configure button.
This option helps to customize the dashboard with configured Dashlets.
1) In Change Audit menu, click the Policy Dashboard drop down and then click Customize icon ![]() .
.

EventTracker displays the Available Dashlets pop-up window.

2) Click the checkbox to select the Dashlet(s), and then click Add.
EventTracker adds the Dashlet(s) to the Dashboard.
OR
Click the checkbox to select the Dashlet(s), and then click Delete.
EventTracker deletes the dashlet(s).
3) Click a donut chart or a legend to view respective system details.

EventTracker displays the System Details Pop-up window.
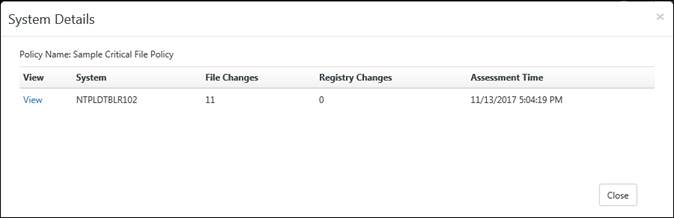
4) Click the View hyperlink to view Change Audit Assessment Details.
EventTracker Inventory is an automated asset management tool, which scans all Change Audit, managed computers, and displays them in an easy accessible web and legacy interface.
Software inventory: To track and audit software installed on Change Audit managed computers.
For detail information please refer EventTracker Control Panel -> Change Audit.
Change Assessment Dashboard displays the most recent results of on demand / scheduled policy comparison.
1 Click the Change policies tab.
Policy details display in dashboard.

|
Icon |
Represents |
|
|
File changes found. |
|
|
Registry changes found. |
|
|
File and registry changes found. |
|
|
Information icon |
|
|
Notes icon |
|
|
Casebook icon |
|
Field |
Description |
|
Title |
Select any title to view policy comparison results for that period and integrity violation details on the Dashboard. |
|
Status |
Select an option from this drop-down list to further filter the policy comparison result. Success – policy comparison executed successfully against the monitored systems. Integrity Violations – policy comparison executed successfully against the monitored systems but integrity violations have been found. Exceptions – policy comparison execution failed. |
|
Delete |
Select the checkbox against the policy comparison result and then click this button. |
2. Click Information ![]() icon to view Policy Details.
icon to view Policy Details.
3. Click the Flag ![]() icon to change status of that particular policy.
icon to change status of that particular policy.
|
Flag Icon |
Represents |
|
|
Un-flagged and no action has been taken |
|
|
Flagged and relevant action is required for that particular incident to solve an issue. |
|
|
Checked the incident and necessary action has been taken care of |
4. Click Notes ![]() icon to enter relevant information about the respective policy.
icon to enter relevant information about the respective policy.
5. Click any Title hyperlink to view Integrity violation details.
6. To add data to a Casebook, click Casebook ![]() icon.
icon.
Casebook window displays to add to a new or existing Casebook.

7. To create a new Casebook, click Add new Casebook.
8. To add data to a new log book, click Add to existing Casebook.
For more details regarding usage of Casebook, refer Casebook.
9. To delete a policy, select the Delete option and then click the Delete button.
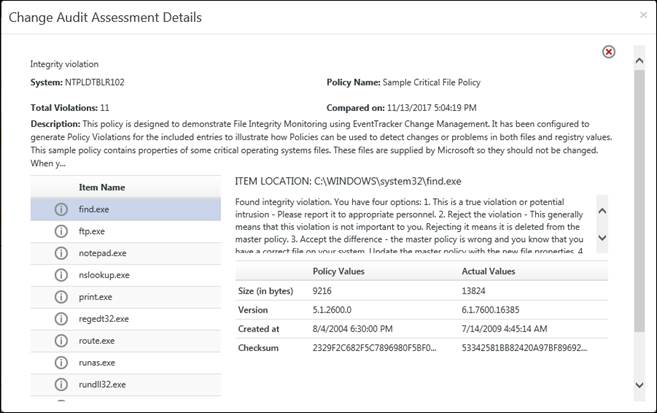
a. To analyze policy comparison result, click the title of the policy comparison schedule on the Dashboard.
EventTracker displays the Policy Comparison Results page.

|
Fields |
Description |
|
System |
Name of the target system where the policy is compared |
|
Policy Name |
Name of the policy compared on the target system. |
|
Total Violations |
Total number of violations detected. |
|
Compared on |
Date and time when the policy was compared. |
|
Description |
Description of the policy. |
|
Item Name |
Name of the policy item. |
|
Policy Values |
Values of the policy item selected in the left pane when the policy was configured. |
|
Actual Values |
Actual Values of the policy item selected in the left pane after the policy comparison is done. This reflects any change in the value of the policy item. |
|
Item Description |
Description of the item selected in e left pane is displayed at the bottom of the right pane. |
|
Fields |
Description |
|
Accept |
If changes are found for the selected item, you can update the master policy with the new value. |
|
Reject |
If you find an item to be irrelevant to the present context, you can select and remove that item from the master policy. |
|
Ignore |
When you generate a report, ignored items will not be considered for report generation. Note that these items are not removed from the master policy. |
|
Save |
Save the policy with changes if any, with the same name. |
|
Save As |
Save the policy with changes if any, with a different name. |
|
Close |
To close the Dashboard. |
|
Icon |
Represents |
|
|
Items accepted. |
|
|
Items ignored. |
|
|
Items rejected. |
b. Click the Item Name to Accept, Reject or Ignore the integrity violation.

If you reject the policy then a confirmation message displays.
c. Click Save or Save As after the changes has been done.
For more information on creating Configuring Policies, refer Change Audit ->Create Configuration Policy.
This option helps you schedule change assessment.
1 To schedule Change Assessment, click the Scheduled Reports icon ![]() in the right-hand corner, and then click New Schedule
in the right-hand corner, and then click New Schedule ![]() icon.
icon.
(OR)
Click Policies in the tree pane, click the gear icon and then select Add Scheduled.
EventTracker displays the Scheduled page.

2 Enter the title of the schedule in the Title field. Select a policy from the Policy Name drop-down list.
3 Type the name of the system(s) in the Search system(s) field and then click the search icon.
EventTracker displays the system group of the systems searched.
4 Select the system(s). Click Show All to view all managed systems and system groups.
(OR)
5 Select system(s)/system group(s) from the Systems list.
6 Select the required time duration to run the schedule. Select an option from the Frequency drop-down list for how often the policy runs.
|
2 NOTE |
|
EventTracker enables the Week Day drop-down list only when you select the Weekly option from the Frequency drop-down list. |
7 Click Save.
This option helps you edit Change Assessment schedules.
1 To Edit Change Assessment Schedules, select a scheduled policy by clicking the scheduled reports icon![]() .
.
2 Select the policy and click on Edit ![]() icon.
icon.
3 Make appropriate changes in the relevant fields, and then click Save.
This option helps you run schedules on demand.
a. To run the schedules on demand, select a scheduled policy in the bottom pane, and then select Run Now.
EventTracker displays the message box with appropriate message.
This option helps to delete schedules.
a) To delete a scheduled policy, select any scheduled policy in the bottom pane, and then select Delete.
EventTracker displays the confirmation message box.
b) Click OK to delete the schedule.
The Compliance dashboard will display data related to the Incidents & Flex Reports. The user will have option in Alerts and Reports module to show the data or graph in the “Compliance dashboard’.
A. In Alerts, edit an alert or create a new alert. In the Alert Configuration page, the user will have an option to “Shown In” data in “Compliance Dashboard”.
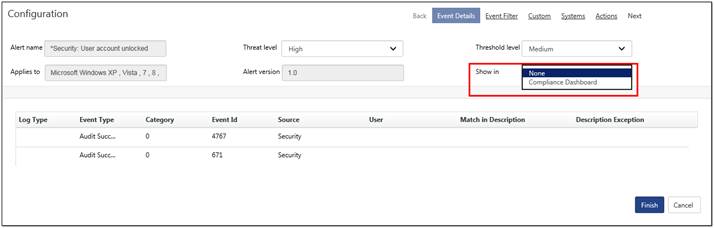
B. In Reports, Schedule a flex report and in the “Disk cost analysis” step, for “Show In” field select the Compliance Dashboard.
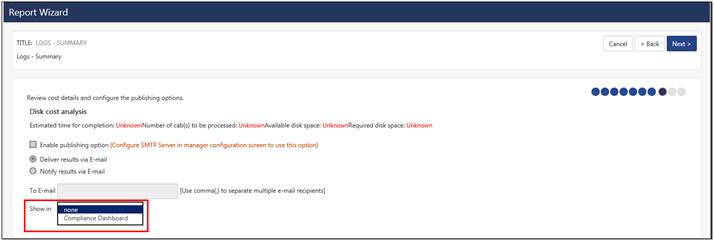
Select the Dashboard icon and select Compliance from the dropdown list.

The Compliance Dashboard gets displayed with the available data.
From v9.1, the user will be able to view compliance summary reports details under the Dashboard tab. If the user has configured compliance summary report, then only the below screen will be displayed:
If no Compliance summary report is configured, the Dashboard will be displayed as shown below:
You also have Default Dashboards for PCI-DSS and NIST 800 171 in the respective tabs.
To create a Dashboard, click the ![]() icon. Enter a Title and description, if required.
icon. Enter a Title and description, if required.
The Dashboard gets created.
|
Click |
To |
|
|
Edit Dashboard |
|
|
Customize Dashlet |
|
|
Configure Dashlet |
|
|
Export details |
|
|
Import details |
|
|
Reset configuration |
To configure a dashlet, click the gear ![]() icon.
icon.
For more information to configure a dashlet, refer: Configure a Dashlet
To customize a dashlet, click the customize icon![]() .
.
Click the Add button. The dashlets gets added in the created dashboard.

To export the configuration, click the export icon![]() . Select the dashlets and click on Export button.
. Select the dashlets and click on Export button.

To import configuration, click the import icon![]() .
.


 GRAY
GRAY RED
RED GREEN
GREEN