This option helps you track success/failure alert notification status.
1) To enable alert notification, click the Admin, and then click Manager.
2) Click Configuration tab, if not selected.
3) Select the Enable alert notification status checkbox, if not selected by default.
|
2 NOTE |
|
You might receive notifications for the configured alerts, but you may not be able to track the success/failure status of those notifications if you disable this option. |
4) To turn off alerts, click Turn off alerts option.
5) To turn off filters, click Turn off filters option.
6) Click Save.
This option helps you purge alert events cache. By default, EventTracker retains event data for seven days. You can configure to hold minimum 24-hour and maximum 90 days event data. You cannot completely purge the cache.
1. To purge alert events cache, in Manager Configuration page, click the Configuration tab.
2. Select the Enable Alert Events Cache for Analyzing Alerts checkbox, if not selected by default.
3. EventTracker enable Purge events from cache older than – days field, if not selected by default.
4. Type the duration in Purge events from cache older than – days field.
5. Click Save.
It is mandatory to enable remedial action at the manager console. Otherwise, you cannot execute remedial action at the agent systems.
1) To configure Remedial Actions, in Manager Configuration page, click the Configuration tab.
2) Select the Enable Remedial Action checkbox, if not selected by default.
EventTracker displays the Caution dialog box.
3) Click OK, and then click Save.
EventTracker provides the facility of generating user configurable alerts for events received by the EventTracker. This feature is very useful in case the user is not always available at the manager console.
In case the multiple instances of an event with a configured alert are received in a short period of time then a large number of alerts will be generated, this could confuse the user.
‘Duplicate Alert Suppression’ feature will handle such a deluge of alerts by suppressing any alert in case it is a duplicate of an alert received earlier, within a particular time frame.
The above settings inform the EventTracker to allow a MAXIMUM of 5 DUPLICATE alerts to be triggered within a timeframe of 300 seconds. An alert is considered a duplicate only if it is triggered by the same event.
This option helps you suppress duplicate alerts.
1) To suppress duplicate Alerts, in Manager Configuration page, click the Configuration tab.
2) Select the Suppress Duplicate Alerts checkbox.
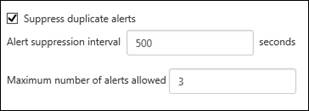
EventTracker enables the Alert suppression interval and Maximum number of alerts allowed fields.
3) Enter appropriate data and then click Save.
This option enables the footer option in e-mail. If the email footer is enabled then all the default alerts which are enabled will contain the manager email footer content. But when the user configures a new alert with email action then the user can provide custom email footer also for the particular alert.
1) To enable footer option in email, in Manager Configuration page, click the Configuration tab.
2) Select the Enables alert e-mail footer option.
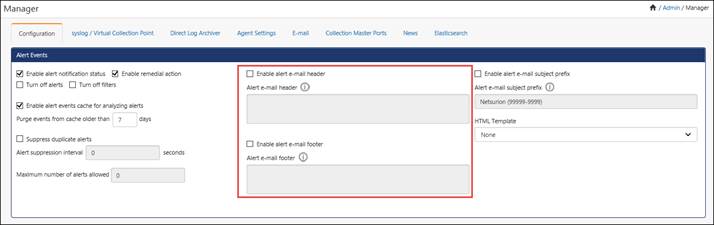
3) To add the Alert Header/Footer, check the options and add the header/footer in the respective fields and then click Save.
This option helps you configure correlation receiver port to receive results of correlation rules.
1) To configure correlation receiver port, in Manager Configuration page, click the Configuration tab.
2) Type the port number in the Send results of all correlation rules to port field.
3) Click Save.
|
2 NOTE |
|
If ‘Event Correlator’ is not installed, then ‘Correlation Receiver’ pane is grayed out/ disabled. By default, correlation receiver receives rules through port 14509. For detail information about Correlator, refer Event Correlator.
|
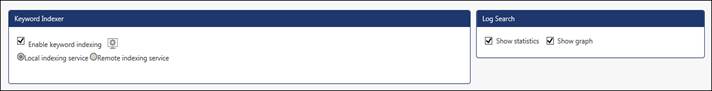
This option helps you enable the ‘Keyword Indexer’ service to index keywords.
1) To Enable Keyword Indexing option in Manager Configuration page, click the Configuration tab.
2) Select the Enable Keyword Indexing checkbox.
|
2 NOTE |
|
If the user(s) disable the Sparse matrix indexing option, it will not create the sparse matrix files for indexing.
|
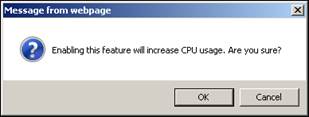
EventTracker displays caution dialog box.
3) Click the Settings icon ![]() to make changes in Indexer Configuration.
to make changes in Indexer Configuration.
The Indexer Configuration window displays.
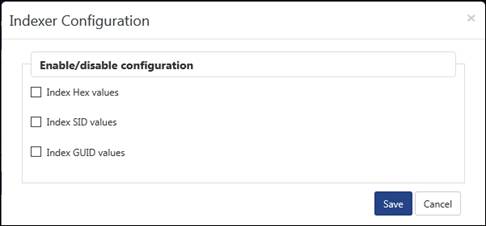
4) Select required option and click the Save button.
|
2 NOTE |
|
• EventTracker by default selects Show statistics and Show graph options in the Log search pane. • Show statistics and Show graph option is not enabled after up gradation. • Clear the Enable Keyword Indexing checkbox if the ‘Keyword Indexer’ hogs the system resources.
|
|
Field |
Description |
|
Local Indexing service |
Keyword indexing process is carried out on the local machine. You are not allowed to change this option. |
|
Remote Indexing service |
Keyword indexing process is carried out on a remote machine to reduce the resource utilizations of the manager. You are not allowed to change this option. |
|
Show statistic |
Show/hide the statistics in the log search page. Clear the Show statistic checkbox to view only graphs in the log search page. |
|
Show graph |
Show/hide the graphs in the log search page. Clear the Show graph checkbox to view only statistics in the log search page. |
|
2 NOTE |
|
‘Keyword Indexing’ option is enabled by default on fresh install and will be grayed out in case the ‘Keyword Indexing’ feature is not present in the certificate file.
|
This option enables you to configure ‘EventTracker Knowledge Base’ Web site.
1) In Configuration pane, select/enter required data.
Also, news URL/contact URL/ETVAS URL/ntopng URL/ETIDS URL is configurable.
The user will also be able to configure ETHoneynet URL.
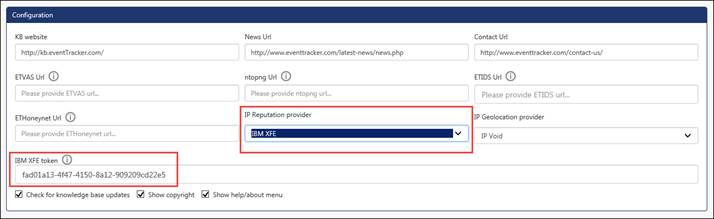
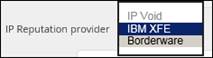
1) Select the IP Reputation Provider from the drop-down option (IP Void/IBM XFE/Borderware).
|
2 NOTE |
|
The IBM XFE token field will be available only if the user selects service provider: IBM XFE. Click the
|
2) Select the IP Geolocation Provider from the drop-down option (IP Void/MaxMind GeoLite).
Option has been provided to enter “Check for knowledge base updates”, “Show Copyright”, “Show help/about menu”.
3) Click the Save button.
This option helps you configure the custom log on message. This banner is displayed to anyone who tries to gain access to EventTracker, prior to typing the user credentials. This could be a warning message or a custom message such as “Welcome! User’ or “This system is for the use of authorized users only’.
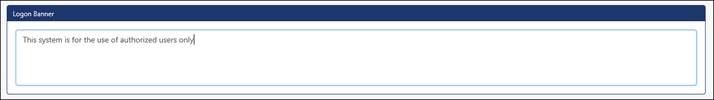
1 To configure custom logon message, in Manager Configuration page, click Configuration tab.
2 Type the warning or custom message in the Logon Banner field, and then click Save.
Enable ‘Collecting Cost Savings Information’ option to run reports (available in Reports Menu -> Flex Reports -> Cost Savings). Enabling this option might hit the performance of ‘EventTracker Archiver’ process if the load of events to be processed is heavy.
1 In Manager Configuration page, click the Configuration tab, if not selected.
2 Check the Collect Cost Savings Information option, and then click Save.
This option is used to update license usage details in EventTracker License Server.
1 In Manager Configuration page, click the Configuration tab, if not selected.
2 Check the Collect Usage data option, and then click Save.
By enabling “Archiver at Group Level”,
· Data for the respective group will be stored in the dedicated file (in the form of cab) with group name suffix added.
· Log search will be faster when user does group level search instead of site level search.
· Report generation will be faster when user configures group level report instead of site level report.

EventTracker by default selects the ‘Enable syslog receiver’ option to enable the EventTracker receiver to receive syslogs sent by non-Windows systems.
1 In Manager Configuration page to enable syslog receiver, click syslog / Virtual Collection Point tab.
2 Select the Enable syslog receiver checkbox, if not selected by default, and then click Save.
For monitoring syslog events, you must configure the UNIX computer to forward syslog events to the computer where the EventTracker Manager is installed. The default syslog port is UDP Port=514. Also, see the FAQ on syslog.
1 To configure UNIX systems to forward syslog messages to EventTracker, identify the IP Address of the computer that is hosting the EventTracker Manager.
2 Log on with the root account in the UNIX computer.
3 Open the syslog.conffile in a text editor. The default path of the syslog.conf file is /etc/syslog.conf.
4 Append the configuration details in the syslog.conf file to forward syslog messages to the EventTracker Manager computer.
5 Save and close the syslog.conf file.
6 Stop and restart the syslog daemon (syslog).
Example: To forward syslog error messages to the IP address 12.19.15.15, add the following detail to the syslog.conf file. *.err @12.19.15.15
|
2 NOTE |
|
For more information, refer the syslog.conf or syslog MAN pages. Syslog configuration may be platform-dependent and it is recommended that you check the platform documentation.
|
Virtual Collection Points (VCP) enable the existing receiver to behave like a collection master without having the physical Collection Points installed. The Existing Collection Point (CP-CM model) requires physically organized Collection Points reporting to a Collection Master. CP-CM model requires a number of hardware facilities and a large degree of deployment difficulty.
VCP provides the solution to break down the huge volume of input events using the existing set up with minimal configuration changes, thus helps to process the received data in a short time at the reporting end.
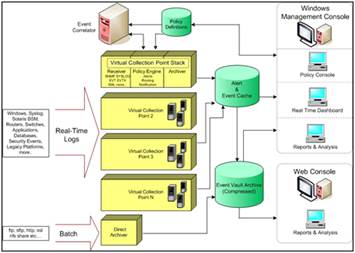
EventTracker Receiver can be configured to listen to any number of ports for Traps and Unix/Linux/Solaris syslogs.
The engine limit for number of VCP's has been removed where as from the UI (Admin -> Manager) still there is a limit of 20 VCP's (10 Windows & 10 SYSLOG). Depending upon the system capacity (Disk, RAM, CPU, etc.,) any number of VCP's can be created. Please contact [email protected] to increase the limit.
|
ET Modules |
Suggested Trap Ports |
|
You need to add the ports that you are using to the Firewall exceptions list. |
|
|
EventTracker Receiver (Incoming) |
14505 default port. 14515, 14525, 14535, 14545, 14555, 14565, 14575, 14585, 14595 514 (UDP/TCP) for syslogs. |
For more information, refer Virtual Collection Point .
This option helps you configure EventTracker receiver to listen on different ports.
1 Click syslog / Virtual Collection Point tab.

2 Check Enable syslog receiver option if not checked by default, and then click Add.
EventTracker displays the Syslog Receiver Port dialog box.

3 Type appropriate Port Number and Description in the respective fields.
|
2 NOTE |
|
The suggested ports start from 1 to 65535 and any of the available ports can be configured.
|
4 In the Cache path field, type/ browse the path to save the cache files.
This is not mandatory, but changing the location would result in enhancing application’s performance.
1. Click the check box Purge archives older than and enter the number of days for which you want to get the data deleted.
6. Click Save.
This option helps you forward received syslog messages in raw format i.e. forwarded with the same format as it is received to a specified destination.
1 To forward syslog messages in raw format, select the Raw syslog Forward checkbox.
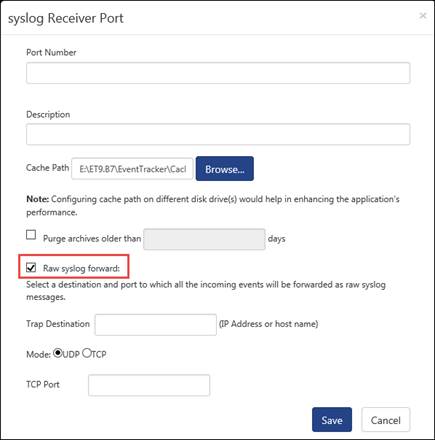
2 Type the host name or IP address of the destination in the Trap Destination field.
3 Select an appropriate Mode of transport.
4 Type an appropriate port with respect to the mode chosen.
The suggested ports start from 1 to 65535 and any of the available ports can be configured.
5 Click Save.
EventTracker Receiver can be configured to listen on 10 ports for Windows Events.
Consider EventTracker Agents in computers Sys2 and Sys3 are forwarding events to Sys1 (EventTracker Manager). By default, the communication happens through port 14505. Suppose you want to configure different ports say for example 14515 and 14525 for Sys2 and Sys3 respectively, do the following:
1 In syslog / Virtual Collection Point tab, click Add button under Virtual Collection Points pane.
EventTracker displays the Receiver Port dialog box.
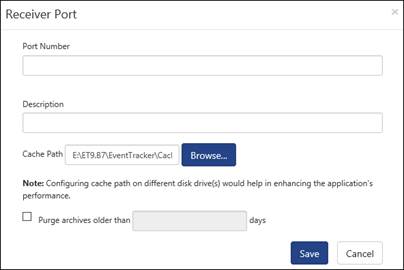
2 Type appropriate Port Number and Description in the respective fields.
3 In the Cache path field, type/ browse the path to save the cache files.
4 Select Purge archives older than option and enter the number of days to purge the data.
5 Click Save.
EventTracker adds the newly configured ports.
EventTracker updates these changes in evtrxer.ini file (…\Program Files\Prism Microsystems\EventTracker)
EventTracker creates EtaConfig_14515.ini & EtaConfig_14525.ini files in RemoteInstaller folder
(…\Program Files\Prism Microsystems\EventTracker\RemoteInstaller).
|
EventTracker Modules |
Trap Ports utilized |
|
You need to add these ports to the Firewall exceptions list |
|
|
EventTracker Receiver (Incoming) |
14505, 14515, 14525 |
1 Click the Admin dropdown, and then click Systems.
2 Move the pointer over the system (sys2) that you wish to upgrade, and then click the dropdown.
3 From the shortcut menu, select Upgrade agent.
4 Select an appropriate agent to upgrade, and then click Next.
5 Select Advanced, and then select Custom config option.
6 Select the path of the custom ‘.ini’ file (EtaConfig_14515.ini) from the File dropdown.
7 Click Upgrade.
EventTracker overwrites etaconfig.ini file with new settings.
1 Click the Admin dropdown, and then click Systems.
2 Move the pointer over the system (sys2) that you wish to upgrade, and then click the dropdown.
3 Click the system (sys3) that you wish to upgrade.
4 From the shortcut menu, select Upgrade agent.
5 Select an appropriate agent to upgrade, and then click Next.
6 Select Advanced, and then select Custom config option.
7 Select the path of the custom ‘.ini’ file (EtaConfig_14515.ini) from the File dropdown.
8 Click Upgrade.
EventTracker overwrites etaconfig.ini file with new settings.
This option helps to archive log files collected from external sources.
1 To archive log files collected from external resources, click the Admin dropdown, and then click Manager.
2 Click the Direct Log Archiver tab.
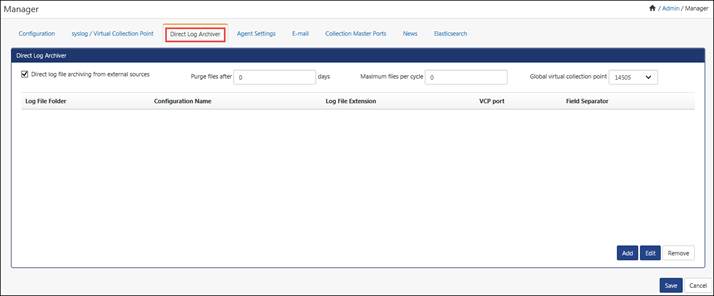
9 Select the Direct log file archiving from external sources checkbox, if not selected.
10 To purge the log files, enter the number of days in Purge files after – days field.
11 To process maximum of ‘N’ files of each configuration in one cycle, enter the number in the option Maximum file per cycle.
12 Select a port from the Global virtual collection point drop-down list.
13 Assign an exclusive port that is not associated with any collection groups.
14 Click Save.
For more information about Direct Log Archiver (DLA), refer DLA.
The user can now configure a DLA configuration by using different VCP port selection and the log parser will now pick all the configurations to parse at the same time as per the port selected.
For more Information, Refer: Enhancement-in-Direct-Log-Archiver-to-specific- different-VCP-port-for-each-configuration.
DLA now supports multiline log parsing.
1. Select the Admin menu, and then select Manager.
Configuration tab displays by default.
2. Select Direct Log Archiver tab.
3. Select the Direct log file archiving from external sources option, and then select the Add button.
Direct Archiver Configuration window displays.
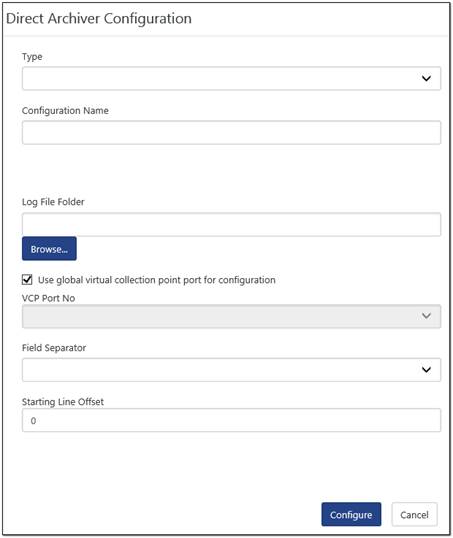
4. Select the Type, Configuration Name, Log File Folder, Field Separator, and Starting Line Offset.
5. In the Type field, select the file type from the dropdown list.
A new feature Starting Line offset has been added. This feature is used to skip N number lines in a log file. In order to ignore irrelevant information in a log file you can specify a number to skip those lines. This feature will be available only for the Type: Others/Logs/W3C.
A field separator can be Tab, Space, etc.
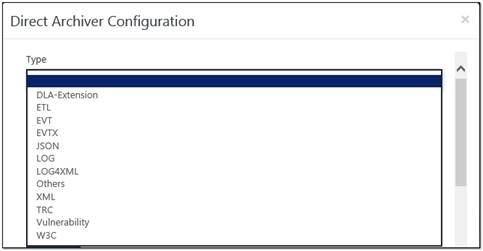
EventTracker now also supports “XML” and “LOG4XML” along with JSON file type and ETL file type.
1. In the Log file configuration window, select the Type as JSON.
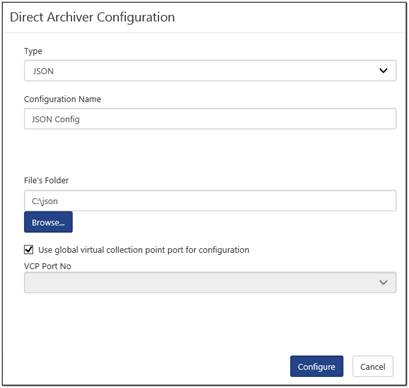
2. Enter required information, and then click the Configure button.

3. Click the Save & Close button.
1. In the Log file configuration window, select the Type as LOG4XML.
2. Enter the configuration name, browse the file, and then click the Configure button.
The configuration window displays.

3. Enter the required field and click the Save & Close button.
This option enables you to configure agent file transfer settings.
1 Select Admin drop down, and then select Manager.
2 In the Manager Configuration page, click the Agent Settings tab.
3 Select the Allow direct agent file transfers checkbox, if not selected.
Associated virtual collection point is the port that you have configured for Direct Log Archiver.
By default, EventTracker stores the files transferred by the agents in the …\Program Files\Prism Microsystems\EventTracker\DLA folder.
4 In the Data Store Folder field, type the path for new folder if you wish to change the file transfer location.
(OR)
Click the Browse button to navigate and select a folder.
5 Click Save.
This option will help you to configure email settings. These are mandatory configuration settings to "Deliver report via E-mail" or "Notify report generation via E-mail" upon generation of scheduled reports. Additionally, to "Send via E-mail", the reports published.
1 Select Admin drop down, and then select Manager.
2 In the Manager Configuration page, click the E-Mail configuration tab.
|
Field |
Description |
|
SMTP Server |
Type the name or IP address of your enterprise mail server. |
|
Port |
Type a valid SMTP server port number. |
|
From E-mail id |
Type a valid sender e-mail address. |
|
To E-mail id |
Type a valid recipient e-mail address. |
|
Email attachment maximum size |
Type the maximum size of attachment file in terms of MB. The default size will be 5 MB. |
|
Enable authentication |
Provides an access control mechanism. It can be used to allow legitimate users to relay mail while denying relay service to unauthorized users, such as spammers. Select this checkbox and type valid administrator user name and password. |
|
Test E-mail |
Click to check whether you have provided valid data. EventTracker displays the confirmation message box. Click OK to continue. EventTracker displays "success" message if the configuration is correct and "failed" message if the configuration is not correct. |
3 Provide the details in required fields, and then click the Save button.
All the Email Ids configured in alerts, reports, and flex reports can be managed from this Email search utility. The Email Ids can be replaced with a new Email Id or removed if it is no more in use or invalid address.
1 In the Manager Configuration page, click the E-Mail configuration tab.
2 Fill the required information to configure the SMTP server for sending email, and then click the Save button.
3 Click the Manage email hyperlink.
EventTracker displays Email search utility window.
|
Field |
Description |
|
Configured Email |
The list of all configured email Ids. |
|
Alerts |
The list of alerts configured with the selected email Id. |
|
Reports |
The list of reports configured with the selected email Id. |
|
Export alerts to excel / Export reports to excel |
Click to export the alerts or reports along with the configured email Id. |
|
Change Option |
Remove or replace the configured email Id. |
4 From Configured Email dropdown, select the required email Id, and then click the Find button.
The alert(s) and report(s) configured with the email Id will be displayed under Alerts and Reports tab, respectively.
1 Click the Manage email hyperlink.
EventTracker displays ‘E-mail search utility’ window.
2 In the Change Options pane, select Replace from the dropdown, if not selected.
3 From the Email ID dropdown, select the Email Id to be replaced.
4 In With field, type the Email Id to be replaced.
5 In the ‘in’ field select where the Email Id is to be replaced. The options are in Alerts or in Reports.
6 Click the Go button.
EventTracker displays confirmation message box.
7 Click the OK button.
EventTracker displays success message box.
If any special character or wrong Email Id is provided, then EventTracker will display the error message.
8 Click the OK button in the success message box.
9 To verify the replacement, click the Configured Email dropdown, select the replaced Email address, and then click the Find button.
EventTracker will display the alerts or reports configured with the selected Email Id.
1 Click the Manage email hyperlink.
EventTracker displays ‘E-mail search utility’ window.
2 In the Change Options pane, select Remove from the dropdown.

3 From the Email ID dropdown, select the Email Id to be removed.
4 In the ‘in’ field select where the Email Id is to be removed. The options are in Alerts or in Reports.
5 Click the Go button.
EventTracker displays confirmation message box.
6 Click the OK button.
EventTracker displays success message box.
If only one report or alert is configured with the selected Email address then EventTracker will not allow remove the Email address.
7 Click the OK button in the success message box.
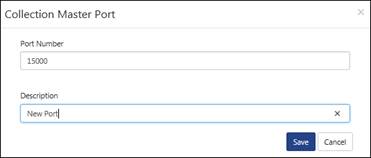
The Collection Master Ports can be configured in Manager.
1. Click the Admin menu, click Manager, and then click Collection Master Ports.
2. Click the Add button.
3. Enter the Port Number:, Description:, and then click the Save button.
4. To edit the Collection Master Ports, click the Edit button.
5. To remove the Collection Master Ports, click the Remove button.
|
2 NOTE |
|
This Collection Master Port option is available on the Console Type: Collection Master |
In this tab, we can make configuration changes for the Elastic Search.
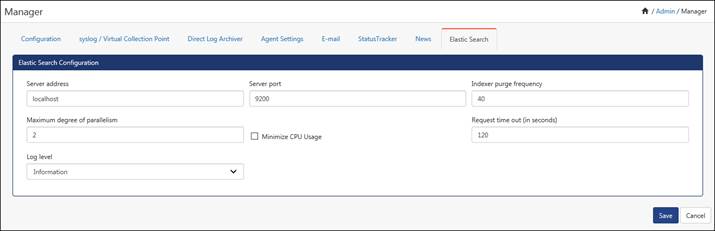
· Enter the server address, port, purge frequency, degree of parallelism and even select the log level from the dropdown list.
· The user can also check the Minimize CPU usage option, if required.
· After making the configuration changes, click Save.
By default the “Resolve Hostname” option will be disabled. In this case, the hostname for the IP addresses will not be resolved (Local or Public IP). User can enable this option by navigating to Admin--> Manager--> Elasticsearch tab, under DNS configuration.
On enabling Resolved hostname option, the alert message will get display.
After enabling this option Resolved hostname the DNS server IP address will be fetched automatically. By default, it is set to Resolve local IP only.
The user can also provide the DNS Server IP manually.
Whenever a local IP address is identified in src_ip_address or dest_ip_address during elastic index, Elasticsearch service will resolves the hostname for IP address and puts the same hostname in the associated CIM fields, i.e. src_host_name or dest_host_name respectively.
When the “Resolve local IP only” option is unchecked, then Elasticsearch will resolve both Public and Local IP addresses.