All configurations for agent(s) are set by default during installation. If you are interested in changing these default configuration settings, then it can be done in EventTracker Agent Configuration.
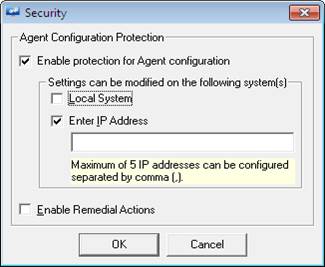
This option enables you to protect the EventTracker agent configuration settings. You can allow local system or specified remote system(s) to modify the agent configurations. Once the agent configuration is protected, then the agent settings will be modified only by local system and/or specified IP addresses.
1 Login to EventTracker Control Panel. Double click EventTracker Agent Configuration.
EventTracker Agent Configuration window displays.
2 Select the File menu, and then select Security.
EventTracker displays Agent Configuration Protection pane.
|
Field |
Description |
|
Enable protection for agent configuration |
Select this checkbox to enable other options in this dialog box. |
|
Settings can be modified on the following system(s) |
Local System: Select this checkbox to protect the current configuration settings only for the local system. Other users cannot modify your settings from their machines. |
|
Enter IP Address: Select this checkbox to protect the current configuration settings for other machines. |
|
|
IP Address: Type the IP addresses in this dialog box. You can configure the current configuration settings up to five IP addresses. The IP addresses specified in this field can modify the agent configuration settings. |
|
|
Remedial Action |
Select the checkbox to enable the remedial action. |
1 Select the Enable protection for Agent configuration checkbox.
2 Select/enter appropriate data in relevant fields, and then select the Save button.
For loading an Agent Template,
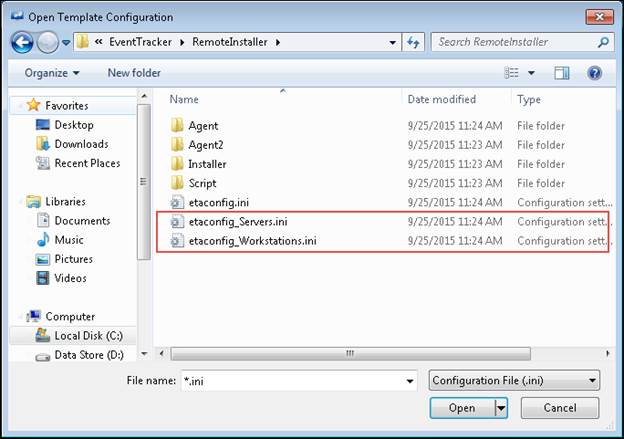
· Select File from the menu and click on the Load a Template option from the dropdown list.

· Browse the template to be selected and click the Open button (Select the etaconfig_Servers.ini or etaconfig_Workstations.ini from the RemoteInstaller folder).
A pop-up message displays.

· Depending on the Operating system, select Yes/No, to get the configuration according to the selected template.
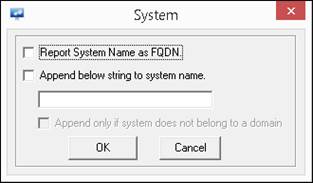
· Click the File option and select Systems from the dropdown list.
The System window gets displayed.
For more Information on this section, Refer: Agent syslog collector to resolve sender IP Address.
1 To enter/update license server configuration details, login to EventTracker Control Panel. Double click EventTracker Agent Configuration.
EventTracker Agent Configuration window displays.

2 Select the File menu, and then select License Server.
By default the license server details are already updated.
3 Update/Enter Server (Name/IP): and Port: number details, if required.
4 Select the OK button.
The amount of free space to be left on storage device can be entered in terms of percentage (%) or in MB.
1. To update settings in EventTracker Manager, open EventTracker Control Panel. Double-click EventTracker Agent Configuration.
Managers tab displays by default.

2. Click appropriate tabs and configure the agent as per the requirement.
3. To configure the amount of free space on storage devices, click the Add button.
Add Destination window displays.
4. Select Guaranteed Delivery Mode (TCP) option.

5. Select Minimum Amount of Free space to be left on Storage Device (%) or Minimum Amount of Free space to be left on Storage Device (MB) option.
Default value for (%) is 20 and default value for MB is 2048 MB.
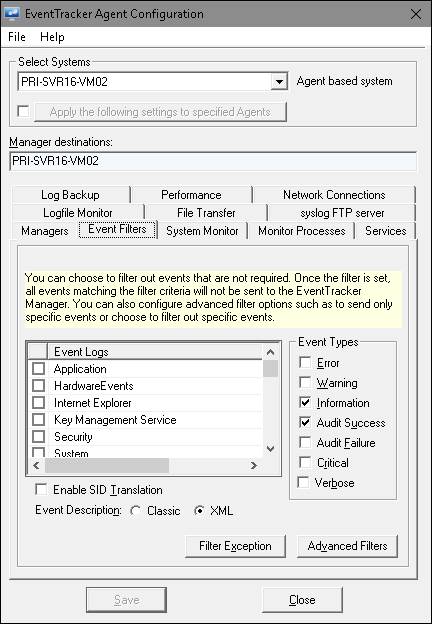
This option enables you to filter events being sent to the Manager. Select appropriate checkboxes under Basic Logs, Special Logs, and Event Types. Event Logs is a dynamic list of Channels. Whenever a new Channel is provided for subscription, EventTracker updates this list automatically.
1 To filter events, double click EventTracker Control Panel, select EventTracker Agent Configuration.
2 Select the system from the Select System hyperlink. Select Event Filters tab.
EventTracker displays the Event Filters tab.
|
Field |
Description |
|
Basic Logs |
Select appropriate checkboxes to filter the events being sent to the Manager. |
|
Special Logs |
Select appropriate checkboxes to filter the events being sent to the Manager. |
|
Event Types |
Select appropriate checkboxes to filter the events being sent to the Manager. Example: Event Types -> Warning The filter is now set and all events with Event Type Warning will be filtered out and will not be sent to EventTracker Manager. |
|
Enable SID Translation |
Select this checkbox to enable SID translation. For more information on SID translation, refer SID-translate.pdf in the EventTracker installation folder. |
|
Enable High Performance mode |
Select this checkbox to switch the Agent performance modes. |
|
Filter Exception |
Click this button to set the filter exceptions for specific events that you want to monitor. |
|
Advanced Filters |
Click this button to set the filters for the specific events that you do not want to monitor. |
By default, EventTracker filters Information and Audit Success events.
3 Set the available filter options appropriately, and then click the Save button.
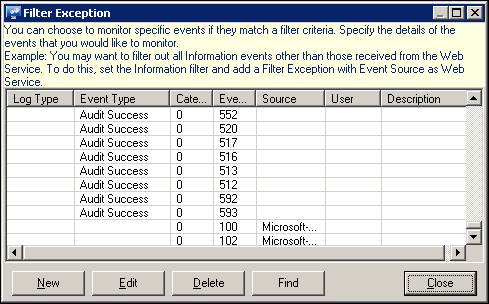
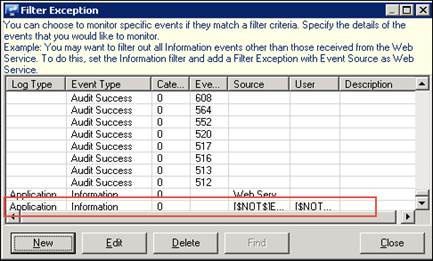
This option helps you to filter events with exception. For example, had you configured agent to filter Information events, all events of ‘Information’ event type will not be forwarded to the Manager. However, if you wish to send specific events of Information event type, you can exempt those events from filtering.
1 To filter events with exception, double-click EventTracker Control Panel, select EventTracker Agent Configuration.
2 Select the system from the Select System hyperlink. Select Event Filters tab.
EventTracker displays the Event Filters tab.
3 Click Filter Exception.
EventTracker displays the Filter Exception pop-up window with a list of events exempted from filtering.
1 To modify event details, select a row and then click Edit.
2 To remove event details, select a row and then click Delete.
3 To find event details, select the Find button.
4 To add filter exceptions, click New.
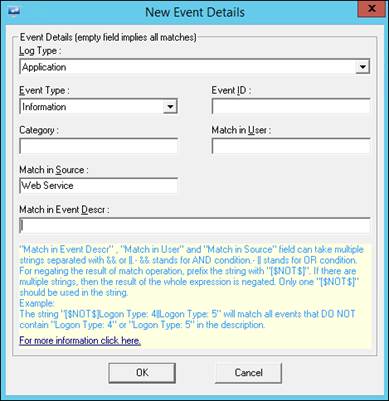
EventTracker displays the Filter Exception pop-up window to select/enter event details.

5 Enter appropriate data in the relevant fields.
For example - Log Type: Application, Event Type: Information, Match in Source: Web Service
6 Click OK.
EventTracker displays the Filter Exception pop-up window with the newly added filter exception.
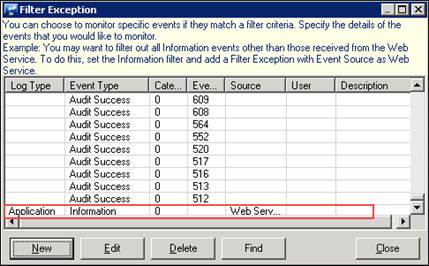
7 Click Close, and then click Save.
For negating the results of User and Source in the Filter Exception list:
a) In EventTracker Agent Configuration window, under Event Filters tab, click the Filter Exception button.
b) Click the New button.
EventTracker displays the New Event Detail window.
c) Enter appropriate data in the relevant fields.
For example - Log Type: Application, Event Type: Information, Match in User: [$NOT$]user, Match in Source: [$NOT$]EventTracker
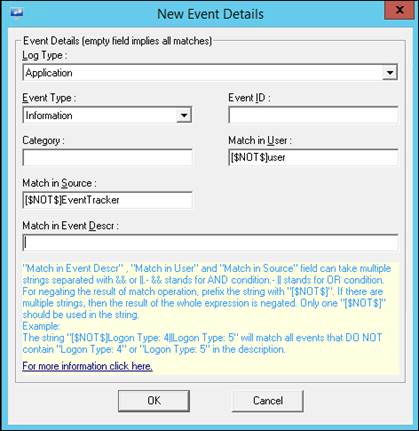
d) Click the OK button.
EventTracker displays the Filter Exception pop-up window with the newly added User and Source filter exception.
e) Click Close and then click the Save button in the Agent Configuration window.
|
2 NOTE |
|
Multiple strings separated with && (And) and II (OR) operators can now be used for both “Match in User” and Match in Source”. |
Filters and Filter Exception go hand in hand, which means you can filter all the events but with exceptions. Whereas Advanced Filters help, you filter out a specific event allowing other events of that type.
1 To filter events with Advanced Filters, double click EventTracker Control Panel, select EventTracker Agent Configuration.
2 Select the system from the Select System hyperlink.
3 Click the Event Filters tab.
EventTracker displays the Event Filters tab.
4 Click Advanced Filters.
EventTracker displays the Advanced Filters pop-up window with a list of advanced filters.

5 Click New.
EventTracker displays the Advanced Filters pop-up window to select/enter event details.
6 Enter appropriate data in the relevant fields and then click OK.
EventTracker displays the Advanced Filters pop-up window with the newly added filter.
7 Click Close.
8 Click the Find button to find event details by entering appropriate data
9 Click the OK button and then click the Close button in the Advanced Filters window.
|
2 NOTE |
|
The filter is set and specific events matching the filter criteria will not be forwarded to EventTracker Manager. All Error Events will be forwarded to the Manager except the events matching the filtered criteria set.
|
10 Click Save.
This option helps you enable SID translation.
1 Double click EventTracker Control Panel, select EventTracker Agent Configuration.
2 Select the system from the Select System hyperlink. Select Event Filters tab.
EventTracker displays the Event Filters tab.
3 Select the Enable SID Translation option.
EventTracker displays the Caution message box.
4 Click Yes and then click Save.
|
2 NOTE |
|
This feature works in all versions of EventTracker. For more information please go through SID-translate.pdf found in the EventTracker installation folder typically, ...\Program Files\Prism Microsystems\EventTracker.
|
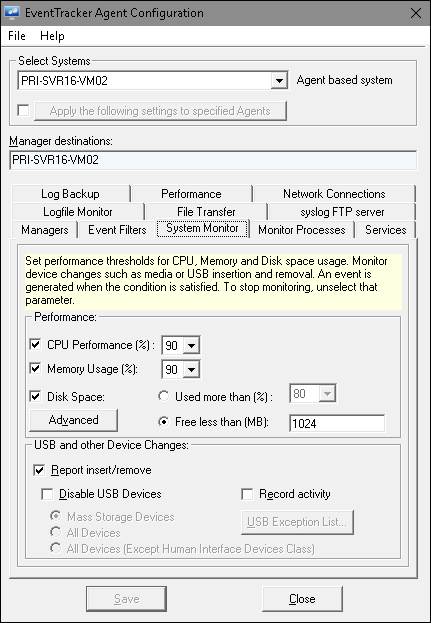
Monitoring CPU, memory performance and disk usage of a system enables the administrator to monitor the general health of a system. You can configure general health thresholds for CPU and Memory Usage. All thresholds are measured in percent terms.
When the configured threshold is crossed, an event will be generated and reported to the manager. An event will also be generated when the thresholds are back to below configured levels.
Care is taken not to report spikes in CPU or memory usage by a process. Therefore, when an event is seen that a system is crossing thresholds, you can be sure that this is for a long enough period and need to investigate.
The default threshold limits are 90% for all variables. A configuration of 0% would disable the monitoring for that specific variable.
USB and other Device Changes option helps to monitor insertion or removal of USB and other media. Also helps to track file transactions that occur in the inserted media.
1 Double click EventTracker Control Panel, select EventTracker Agent Configuration.
2 Select the system from the Select System hyperlink.
3 Click the System Monitor tab.
EventTracker displays the System Monitor tab.
|
Field |
Description |
|
Performance |
|
|
CPU Performance (%) |
Select a threshold limit to monitor CPU performance from the drop-down list. |
|
Memory Usage (%) |
Select a threshold limit to monitor memory usage from the drop-down list. |
|
Disk Space Usage (%) |
Select a threshold limit to monitor disk space usage from the drop-down list. |
|
Handle |
Select a threshold limit to monitor handle usage of the system. |
|
Thread |
Select a threshold limit to monitor thread usage of the system. |
|
USB and other Device Changes |
|
|
Report insert/remove |
Select this checkbox to track insertion or removal of USB or other devices. This checkbox is selected by default. |
|
Record activity |
Select this checkbox to monitor file transactions occur in the inserted devices. |
|
Disable USB Devices |
Select this checkbox to disable USB devices. The selection will enable the ‘USB Exception List’ button. |
|
USB Exception List |
Click this button to add the USB device ID or serial number in the exception list. The listed USB devices will not be disabled when inserted. |
To change the disk space configuration values,
1. Click the Advanced button.
Advanced Configuration window displays.
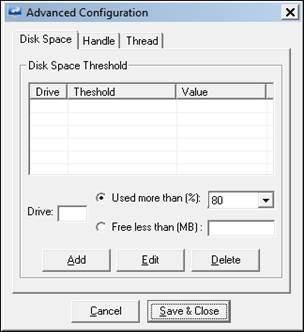
2 Under the Disk Space, enter the Drive: name
3 Select/Enter the required value in Used more than % drop-down or Free less than (MB).
4 To edit or delete the disk space configuration, click the Edit or Delete button accordingly.
5 Select Save & Close once necessary changes have been done.
6 Select the required Performance, USB and other Device Changes options.
7 ClickSave & Close.
To configure handles usage,
1 In the Advanced Configuration window, click onHandle in the menu bar.
2 Select the count from the dropdown box.
Ex: For “Monitor System handles usage if more than %”, 90 is selected (Default).
3. Click Save & Close.

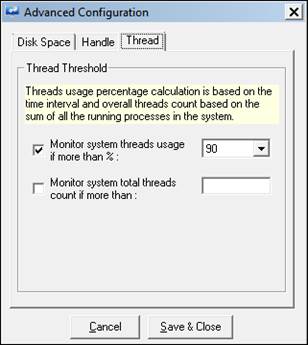
To configure Thread usage,
1 Select the count from the dropdown box.
Ex: For “Monitor System threads usage if more than %”, 90 is selected (Default).
2. Click Save & Close.
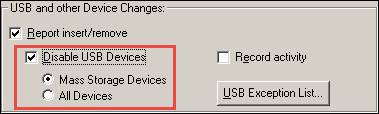
For Blocking all types of USB devices, go to the USB and other device changes pane.
1. Select the Disable USB Devices checkbox.
2. Sub-option gets enabled, namely, Mass Storage Device and All Device.
3. By enabling the Mass storage Device option, the user can block USB Devices like Pen Drive, Hard Disk.
4. When the All Devices option is enabled, it will block or disable all the devices like mouse, pen drive, external CD-DVD, external hard disk, USB ear phone/head phone, tablet and mobile devices connected either USB storage device, or MTP or PTP type.
While disabling USB Devices on a particular computer, you can also exempt and enable USB devices from monitoring.
1 To configure USB Exception List, select the Disable USB Devices checkbox.
2 Click USB Exception List button.
EventTracker displays the ‘USB Exception List’ pop-up window.
3 Type the USB serial number in decimal format or hexadecimal format in the Enter USB Serial Number field, and then select the Format option accordingly.
OR
Type USB device ID in the Enter USB Device ID field.
4 Click the Add button.
EventTracker adds the newly entered serial number or device Id in the exception list.
5 Click Save & Close button.
6 In ‘Windows Agent Configuration’ page, click the Save button to save the configuration changes.
|
2 NOTE |
|
Please refer How to – Monitor Removable Media Devices document for more details on creating exception list and its functionality. |
This option enables you to monitor installation and un-installation of applications, and monitor application usage. EventTracker logs a custom information event whenever a monitored application is opened or closed. These events are received at the Console and helps in tacking the application usage.
EventTracker monitors all processes specified in ‘Include List’ and ignores processes specified in ‘Exclude List’.
The option Enable process monitoring will help in monitoring the process created and terminated. The user can also filter out the processes that need not be monitored.DLL and image files can also be monitored that are load by a process.
1 Double click EventTracker Control Panel, select EventTracker Agent Configuration.
2 Select the system from the Select System drop-down, and then select the Monitor Processes tab.
EventTracker displays the ‘Monitor Processes’ tab.

|
Field |
Description |
|
Monitor App Install/ Uninstall |
Select this checkbox to monitor installation and un-installation of applications. |
|
Enable Process Monitoring |
Select this checkbox to monitor processes. This selection enables the Exclude List and Include List buttons. |
|
Exclude List |
Enables you to set the processes that you do not wish to monitor. |
|
Include List |
Enables you to set the processes that you wish to monitor. |
|
2 NOTE |
|
Enable Process Monitoring option is a licensed feature and will be available only if the license is purchased. |
4 Select appropriately the Monitor App Install / Uninstall and Enable Process Monitoring options.
Under the Option “Enable Process Monitoring”
· The option Process Creation/Process Termination helps in monitoring the process launched/closed.
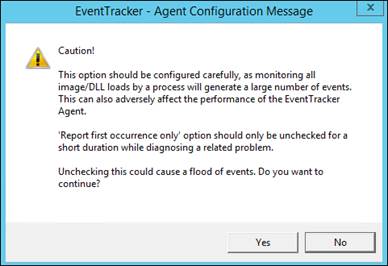
· The option Enable DLL/Image Monitoring helps in monitoring the DLL’s and the image file loaded by the process.
· The option “Report occurrence only” will be checked by default. If you wish to uncheck it, the following message will be displayed.
5 Select the Save button.
1 To filter applications that need not be monitored, double click EventTracker Control Panel, select EventTracker Agent Configuration.
2 Select the system from the Select System drop down.
3 Select Monitor Processes tab.
EventTracker displays the ‘Monitor Processes’ tab.
4 Select the Enable Process Monitoring checkbox, if not selected.
5 Select App Exceptions.
EventTracker displays ‘Process Exclude List’ dialog box.
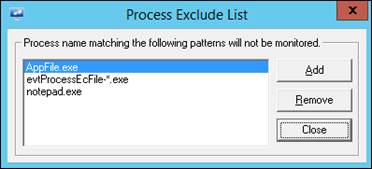
6 Click the Add button.
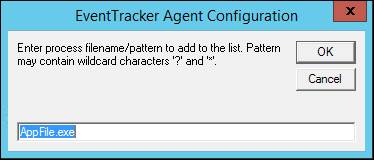
EventTracker opens a textbox to type the file name of the process.

7 Type the application name with .exe extension that you do not want to monitor.
For Example: AppFile.exe
|
2 NOTE |
|
The process name should be in .exe format. |
8 Click OK and then click Save.
1 To filter applications that need to be monitored, double click EventTracker Control Panel, select EventTracker Agent Configuration.
2 Select the system from the Select System drop down. Select Monitor Processes tab.
EventTracker displays the ‘Monitor Processes’ tab.
3 Select the Enable Process Monitoring checkbox, if not selected
4 Click Include List.
EventTracker displays ‘Process Include List’ dialog box.
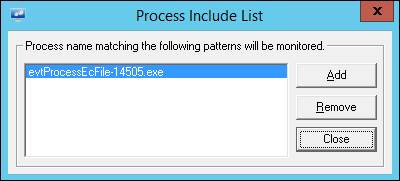
5 Click Add.
EventTracker opens a textbox to type the file name of the process.
6 Type the application name with .exe extension that you want to monitor.
7 Click OK and then click Save.
By default, EventTracker monitors all Windows Services for stop/start. If a service stops, an event will be sent immediately to the Manager. An event will also be sent if a stopped service restarts.
You can also choose to automatically restart services that have been stopped.
There may be certain services that you may not want to monitor. You can filter out such services from the monitoring list.
The service name that needs to be configured can be either the name as displayed in Control Panel -> Services or the display name. While configuring the service name, please ensure that it is spelt correctly.
This option helps to add services to the restart list.
1 Double click EventTracker Control Panel, select EventTracker Agent Configuration.
2 Select the system from the Select System hyperlink. Select the Services tab.
EventTracker displays the Services tab.

|
Field |
Description |
||||||||||
|
Services Monitoring |
This checkbox is selected by default to monitor all Windows services. ‘Service Restart List’ and ‘Service Monitor Exceptions’ will be enabled only if ‘Service Monitoring’ checkbox is selected. |
||||||||||
|
Service Restart List
|
By default following services are monitored:
Click Add to add selected services to restart when they stop. Click the Remove button to remove the services from the ‘Services restart list’. |
||||||||||
|
Service Monitor Exceptions |
Click Add to add services that you do not want to monitor. Click Remove to remove the services from the list. |
3 Click Add under Service Restart List.
EventTracker displays the Enter Service Name field to type the name of the service.
4 Type the name of the service, and then click OK.
5 Click Save.
1 Double click EventTracker Control Panel, select EventTracker Agent Configuration.
2 Select the system from the Select System hyperlink, and then select the Services tab.
3 Click the Add button under Service Monitor Exceptions.
4 Type the name of the service that you do not wish to monitor in the Enter Service Name field.
5 Click OK and then click Save.
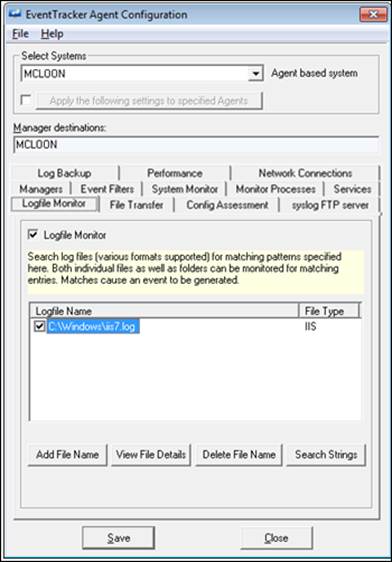
This option enables you to monitor multi-vendor log files with matching keyword entries. EventTracker generates an event if any matching record is found. The Log file monitoring configurations can be done through EventTracker Agent Configuration provided on the EventTracker Control Panel. In the EventTracker Enterprise (Web GUI), you can only view the Logfile monitoring settings.
1 Double-click EventTracker Agent Configuration on the EventTracker Control Panel.
2 Select the system from the Select System drop-down, and then select Logfile Monitor tab.
EventTracker opens the ‘Logfile Monitor’ tab.

|
Click |
To |
|
Add File Name |
Add a log file that you wish to monitor. |
|
View File Details |
View log file details. |
|
Delete File Name |
Delete the log file name from the list. |
|
Search Strings |
Configure the strings to search. |
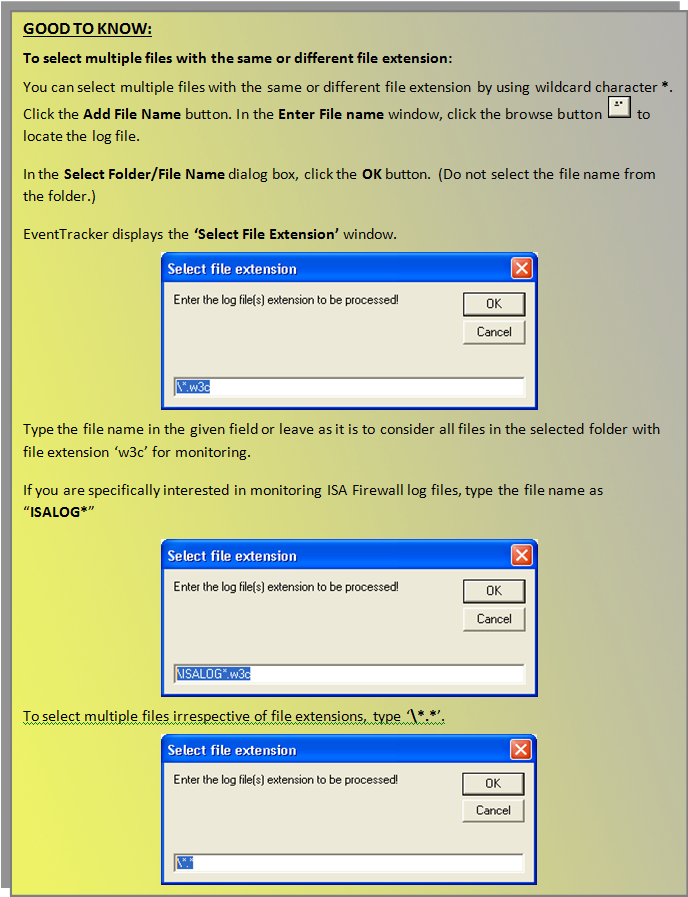
3 Click the Add File Name button.
EventTracker displays the ‘Enter File Name’ window.

|
2 NOTE |
|
We have provided standard and custom date and time formats to configure Agent LFM. Now the configured files in the Agent LFM will be parsed as per the selected date and time formats.
|
For more Information, refer: Enhancement-in-LFM-to-consider-the-date-and-time-mentioned-in-the-log-file
4 Click the Get All Existing Log Files checkbox, if you want all the existing files prior to this configuration and the files that are logged after this configuration.
5 Select the logfile type from the Select Logfile Type drop-down list.
6 Type the path in the Enter File Name field.
(OR)
Click the browse button to locate the log file.
EventTracker displays the ‘Select Folder/File Name’ dialog box.
7 In Select Folder name:, select appropriate folder associated with selected Log File Type.
8 Select the Show all the files checkbox to view all files with different file extensions.
9 Click OK.
EventTracker displays the ‘Enter File Name’ window with the file location.
10 Click OK.
EventTracker displays the ‘EventTracker Agent Configuration’ message box.
11 Click Yes.
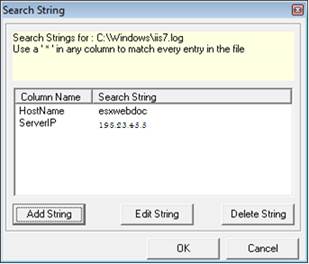
EventTracker displays the Search String dialog box.
12 Click the Add String button.
EventTracker displays the ‘Enter Search String’ dialog box.
13 Select the file name from the Select Field Name drop-down list.
14 Type the string that you want to search in the Enter Search String field.
EventTracker displays the Enter Search String dialog box.
15 Click OK.
EventTracker displays the Search String dialog box.

16 Click OK.
EventTracker displays the ‘Agent Configuration’ window with the newly added Logfile entry.
17 Click the Save button.
This option helps you to view files details.
1 To view file details in EventTracker Control Panel, open the EventTracker Agent Configuration window.
2 Select the system from the Select Systems drop-down list.
EventTracker displays the ‘Logfile Monitor’ tab.
3 Click the Logfile Monitor tab.
4 Select the log file from the list under Logfile Name.
5 Click View File Details.
EventTracker displays the ‘Enter File Name’ window
6 Click Close.
This option helps you delete log file monitoring settings.
1 To delete log file monitor settings in EventTracker Control panel, open the EventTracker Agent Configuration window.
2 Select the system from the Select Systems drop-down list, and then select the Logfile Monitor tab.
3 Select the log file from the Logfile Name list, and then select Delete File Name.
4 Click Save on the Agent Configuration window.
This option helps you search strings.
1 In EventTracker Control panel, open the EventTracker Agent Configuration window.
2 Select the system from the Select Systems drop-down list.
3 Click the Logfile Monitor tab.
4 Select the log file from the Logfile Name list.
5 Click Search Strings.

6 Click Add String.
EventTracker displays the Enter Search String dialog box.
7 Select the file name from the Select Field Name drop-down list.
8 Type the string that you want to search in the Enter Search String field.
EventTracker displays the Enter Search String dialog box with newly added search string entry.
9 Click OK.
EventTracker displays the Search String dialog box with newly added search string.
To modify, click Edit String. Enter appropriately in the relevant fields in the displayedEnter Search String dialog box, and then click OK.
OR
To delete, select the string you want to delete and then click Delete String in the Search String dialog box.
10 Click OK on the ‘Search String’ dialog box.
EventTracker displays the ‘Agent Configuration’ window with the modified settings.
11 Click Save.
NOTE: When LFM is configured there are possibilities that CPU usage of the EventTracker Agent might go high.
This option helps you monitor logs generated by Check Point.
|
2 NOTE |
|
Severity level of mapping for Checkpoint logs with EventTracker log and event type is given in the table below. |
|
Checkpoint log attribute (ET event category) |
Checkpoint log attribute value |
EventTracker log type |
EventTracker Event type |
|
Alert 0 (“Alert’) |
Alert |
Application |
Warning |
|
Alert 1 (“snmptrap’) |
snmptrap |
Application |
Warning |
|
Alert 2(“mail’) |
|
Application |
Warning |
|
Alert 3 (“useralert’) |
Useralert |
Application |
Warning |
|
Alert 4 (“useralert2’) |
Useralert2 |
Application |
Warning |
|
Alert 5 (“useralert3’) |
Useralert3 |
Security |
Audit Failure |
|
Audit Status 0 |
Failure |
Security |
Audit Success |
|
Audit Status 0 |
* |
Security |
Audit Success |
|
* 0 |
* |
Application |
Information |
1 To monitor checkpoint logs in EventTracker Control panel, open the EventTracker Agent Configuration window.
2 Select the system from the Select System drop-down list, and then select the Logfile Monitor tab.
3 Click the Add File Name button.
EventTracker displays the Enter File Name dialog box.
4 Select the logfile type as ‘CHECKPOINT’ from the Select Log File Type drop-down list.
EventTracker unfolds a pane with configuration options.

5 Select an option from the Communication Method drop-down list.
|
Communication method options |
Description |
|
OPSEC_SSLCA |
Encryption Method: 3DES Compressed: No |
|
OPSEC_SSLCA_COMP |
Encryption Method: 3DES Compressed: Yes |
6 Type LEA Server Name. Type the Client DN.
Check Point generated this string while configuring the OPSEC Application.
7 Type the Server DN.
This is the Check Point Gateway DN.
8 Click the browse button ![]() to locate SSLCA file.
to locate SSLCA file.
9 Select the SSLCA file and then click Open.
EventTracker populates the SSLCA file field
10 Type the Server IP.
This is the IP of the host where Check Point is installed.
11 Type the Server Port.
This can be any port but should be consistent with what you have entered earlier in the fwopsec.conf file.
|
Field |
Description |
|
Active |
This option is selected by default. Select this option to receive live Check Point logs from the point in time the configuration takes effect. |
|
Historical |
Select this option to read from previous logs and the current logs as well. This option has two modes namely Current Logs and All Logs. Select the Current Logs option to read from the first record of the current log. This mode is selected by default. Select the All Logs option to read from all the backed up logs and the current logs. |
12 Click OK.
EventTracker displays the ‘Agent Configuration’ window.

13 Click Save.
For information regarding How to configure EventTracker Agent to read CheckPoint logs, please refer CheckPoint Guide.
This option helps you monitor logs generated by VMware. VMware severity values are mapped to EventTracker event types.
The mapping of VMware log severity value:
|
VMware severity |
ET event type |
Description |
|
Error |
Error |
If VMware logs on severity value as ‘Error’, then EventTracker agent also generates event type as Error. |
|
Info |
Information |
If VMware logs on severity value as ‘Info’, then EventTracker agent generates event type as Information. |
|
Warning |
Warning |
If VMware generates logs on severity value as ‘Warning’, then EventTracker generates event type as Warning. |
|
User |
Information |
If VMware generates log with severity value ‘User’, then EventTracker generates event type as Information. |
The mapping of VMware task state with event type:
|
Task State |
ET Event type |
Description |
|
Error |
Error |
If VMware logs on Task state as ‘Error’, then EventTracker agent also generates event type as Error. |
|
Queued |
Information |
If VMware logs on Task state as ‘Queued’, then EventTracker agent generates event type as Information. |
|
Running |
Information |
If VMware logs on Task state as ‘Running’, then EventTracker agent generates event type as Information. |
|
Success |
Audit Success |
If VMware logs on Task state as ‘Success’, then EventTracker agent generates event type as Audit Success. |
1 To monitor VMware logs in EventTracker Control Panel, open the EventTracker Agent Configuration window.
2 Select the system from the Select System drop-down list.
3 Click the Logfile Monitor tab.
4 Click the Add File Name button.
EventTracker displays the ‘Enter File Name’ dialog box.
5 Select the logfile type as VMWARE from the Select Logfile Type drop-down list.
EventTracker unfolds a pane with configuration options.
|
Field |
Description |
|
VMware URL |
Type a valid URL, e.g. https://esxvcserver/sdk/vimService You can also replace the server name with the IP address. |
|
User Name |
Type valid user name. |
|
Password |
Type valid password. |
|
Timeout |
Connection timeout. |
6 Type appropriately in the relevant fields.
7 Click Test Connection to check if the configuration parameters you have entered are correct.
8 Click OK.
EventTracker displays the Agent Configuration window.

9 Click Save.
An option is provided to get the log source and computer name from user(s) for all supported format.
Event id 3230 will get generated based on this property. If user does not give any value then by default it will consider Source as "EventTracker" and System Name as "Local computer name"
1. Select Add File Name.

NOTE: System name allowed special characters are “-“and “_”.
2. In the Enter File Name window, enter the file path, the Event Source and the System name and click OK.
NOTE: For VMware, Checkpoint, Evt and syslog, this new option will not be available.
Another enhancement is extracting the device ID from syslog device while it is relaying. It will extract the Device ID from event description by using regular expression. After extracting the value from description it assigns it to “Computer Name” standard property.
Example: FG1K5D3I14802285@ntpldtblr104-syslog

NOTE: The allowed special characters for system name are “.”, “_” and “-“
NCM (Network connection monitoring) provides you with the capability to effectively monitor for network connections on any system in your enterprise. It is a feature that provides you security beyond the firewall by detecting threats from inside the firewall as well as keeping the external attackers at bay.
It helps you keep track of various happenings like connections established by remote applications, unauthorized connections to server and connections made to standard ports.
NCM provides second level security beyond firewall. NCM can drastically reduce internal security threats and can be configured to raise an alert whenever any intruder outside a list of trusted IP addresses attempts to make network connection. The NCM functionality can also be set at high security mode wherein an event is generated for all incoming and outgoing connections.
The NCM functionality facilitates to achieve the following key objectives:
§ Host based intrusion detection
§ To provide second level security and complement to firewall and anti-virus
§ In strengthening security policies
§ To improve security policies against inside security breaches
§ To monitor all network connections (TCP and UDP)
§ For constant unattended, reliable monitoring of intrusion detection
§ Flexible configuration as per the business requirement
1 Double click EventTracker Control Panel; select ‘EventTracker Agent Configuration’.
2 Select the system from the Select System hyperlink.
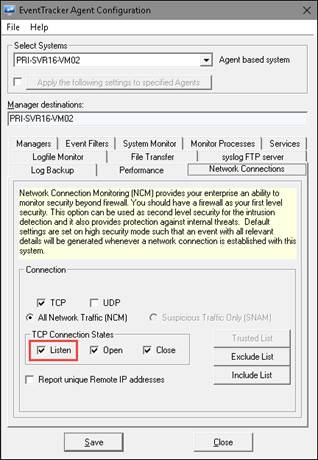
3 Click the Network Connections tab.
EventTracker displays the ‘Network Connection’ tab.
|
2 NOTE |
|
· The “Listen” option is provided to monitor the process whose ports are in listen state. The option will be disabled by default. The user needs to enable it for monitoring the ports in listen state.
|
For more information, refer: Enhancement-in-Network-monitoring-to-monitor-listening-ports.
|
Field |
Description |
|
TCP |
This checkbox is selected by default to monitor TCP network connections. |
|
UDP |
This checkbox is selected by default to monitor UDP network connections. |
|
Connection States |
|
|
Listen |
To monitor the process whose ports are in listen state. |
|
Open |
This checkbox is selected by default to monitor opened TCP/UDP connections. |
|
Close |
This checkbox is selected by default to monitor closed TCP/UDP connections. |
|
All Network Traffic (NCM): By default, EventTracker selects this option. |
|
|
Exclude List |
Click this button to configure the network connections that need not be monitored. A notification will be sent for the entries in this list, if the port is open. |
|
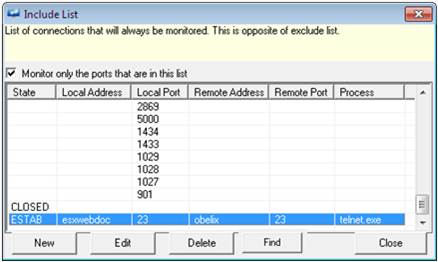
Include List |
Click this button to configure the network connections to monitor. Entries in this list will always be monitored. ‘Include Network Connections List’ always override the ‘Exclude Network Connections List’. |
|
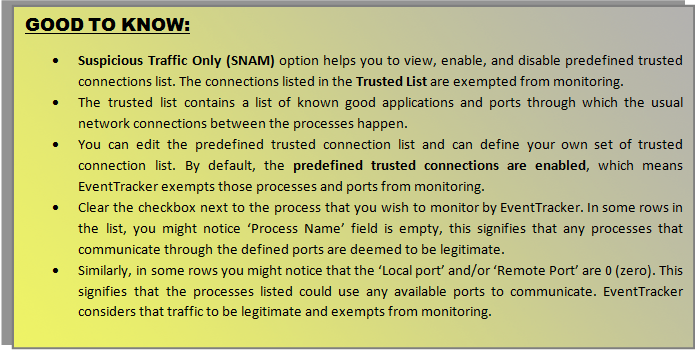
Suspicious Traffic Only (SNAM) |
|
|
Trusted List |
Click this button to view and configure trusted network connections. |
4 Select or clear the TCP or UDP checkbox.
5 Select the Save button.
1 Double click EventTracker Control Panel; select ‘EventTracker Agent Configuration’.
2 Select the system from the Select System hyperlink. Select Network Connections tab.
EventTracker displays the ‘Network Connections’ tab.
3 Select Exclude List.
EventTracker displays the Exclude List pop-up window.

4 Click New.
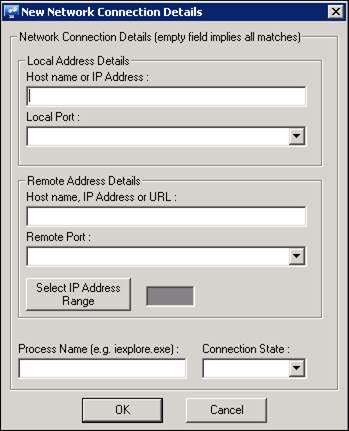
EventTracker displays the Exclude List window to type New Network Connection Details.
|
Field |
Description |
|
Local Address Details |
|
|
Host Name or IP Address |
Type the host name or the IP address in this field. |
|
Local Port |
Select a local port from the drop-down list. |
|
Remote Address Details |
|
|
Host name, IP Address or URL |
Type the host name, IP address or URL in this field. |
|
Remote Port |
Select a remote port from the drop-down list. |
|
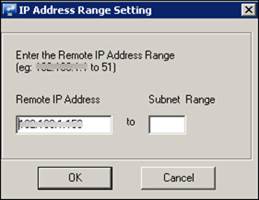
Select IP Address Range |
Click this button to add IP address range. EventTracker displays the IP Address Range Setting dialog box.
Type the range until which you want to monitor the IP network connections. This option is available only when you Type the IP address in Host name, IP address or URL field. |
|
Process Name |
Type the process name in this field. |
|
Connection State |
Select a connection state from the drop-down list. |
|
2 NOTE |
|
If a field is left blank, a wildcard match for that field is assumed. For example, leaving the Local Port field blank implies that any value in that field is acceptable. |
5 Enter appropriate data in relevant fields.
6 Click OK.
EventTracker displays the Exclude List with the newly added entry.

7 To modify the network connection details, click Edit.
8 To delete the network connection details, select the network connection details you want to delete from the list, and then click Delete.
9 To find network connection detail, click the Find button and enter appropriate data in the required field.
10 Click Close on the Exclude List pop-up window.
11 Click Save.
1 Double click EventTracker Control Panel; select ‘EventTracker Agent Configuration’.
2 Select the system from the Select System hyperlink.
3 Click the Network Connections tab.
EventTracker displays the ‘Network Connection’ tab.
4 Select the appropriate checkboxes.
5 Click Include List.
EventTracker displays the Include List pop-up window.
6 Select the Monitor only the ports that are in this list checkbox to monitor only the ports present in the list, and then click Close.

7 To add more network connection details, click New.
EventTracker displays the Include List window to type the New network connection details.
8 Enter appropriate data in the relevant fields.

9 Click OK.
EventTracker displays the Include List with the newly added entry.
10 To modify the network connection details, click Edit.
11 To delete the network connection details, select the network connection details you want to delete from the list, and then click Delete.
12 Click Close, and then click Save.
This feature is an enhancement of the existing ‘Network Connection Monitoring’. This option enables you to monitor the suspicious usage of TCP or UDP ports and their connection states. By default, all the connections are suspicious and you can exempt applications and ports from monitoring. EventTracker is shipped along with a list of applications and ports, which are not harmful to any enterprise environment. As discussed, EventTracker Agent will not monitor these White-listed applications and ports.
|
2 NOTE |
|
Prior to enabling EventTracker Agent to monitor Suspicious Traffic, apply all the latest Microsoft patches / hotfixes if the operating system is Windows 2000. |
This option helps you to monitor suspicious connections and to view predefined trusted connections list. EventTracker does not monitor the connections listed in Trusted List. You can also edit predefined trusted connection list and define your own set of trusted connection list.
1 To view Trusted List in EventTracker Control panel, open the EventTracker Agent Configuration window.
2 Select the system from the Select Systems drop-down list.
3 Click the Network Connections tab.
EventTracker displays the Network Connections tab.
4 Select Suspicious Traffic Only (SNAM) option. Select the Trusted List button.
EventTracker displays the ‘Trusted Connections List’ dialog box
|
Click |
To |
|
|
Add new trusted connections. EventTracker displays’ Trusted Port Details’ dialog box.
Type appropriate details in the relevant fields and then click OK. You can use wild cards to search processes. For example, had you configured Virtual Collection Points and wish to add all EventTracker Receiver processes, it is enough to provide the Process name as EtReceiver*.exe. You can also use |
|
|
Select a process from the list and then click Edit. EventTracker displays ‘Trusted Port Details’ dialog box. Edit required details in the relevant fields and then click OK. |
|
|
Select a process from the list, and then click Delete. EventTracker displays confirmation message box. Click Yes to delete the selected entry. |
|
|
Add programs installed in your computer to the trusted list. |
|
|
Add programs included in the Firewall Exceptions list to the trusted list. |
|
|
Close the ‘Trusted Connections List’ dialog box. |
This option helps you add programs installed in your computer to the trusted list. You can enable or disable the entries in the trusted programs list. Enable means the processes and the ports used by the processes are legitimate and disable means illegitimate and EventTracker monitors them.
1 To add programs to trusted list, click Add Program.
EventTracker displays the ‘Add Program to Trusted List’ window.
2 Select the checkbox against the programs or select the Select All checkbox to select all the programs.
3 Click Add.
EventTracker adds the selected program to the Trusted Connections List.
4 Click Close and then click Save.
This option helps you add the processes and ports in the Firewall programs and ports Exceptions to the trusted list.
1 To add firewall exception to the trusted list in Trusted Connections List, click Add Firewall List.
EventTracker displays the ‘Add Program/Port to Trusted List’ window.

By default, EventTracker selects the Add Program option and displays the programs in the exceptions list.
(OR)
Select the Add Port option, EventTracker displays available ports in the exception list.
2 Select the programs or select the Select All checkbox and then select Add to add programs to the trusted list.
EventTracker adds the selected items to the ‘Trusted Connections’ List.
Performance monitoring enables the administrator to monitor the general health of processes on a system. You can configure general process health thresholds for CPU and Memory Usage per process. CPU usage is measured in terms of percentage while memory usage is measured in absolute terms.
When the configured threshold is crossed, an event will be generated and reported to the Manager. An event will also be generated when the thresholds are back to below configured levels.
Care is taken not to report spikes in CPU or memory usage by a process. Therefore, when an event is seen that a process is crossing thresholds, you can be sure that this is for a long enough period and need to investigate.
By default, all processes will be monitored and the default threshold limits are 1024MB of Memory Usage and 85% of CPU.
You can also choose to filter out processes that you do not want to monitor. By default, all processes will be monitored.
1 Double click EventTracker Control Panel, select EventTracker Agent Configuration.
2 Select the system from the Select System drop-down, and then select the Performance tab.
EventTracker displays the Performance tab.

|
Field |
Description |
|
|
|
|
CPU Performance (%) |
Select CPU Performance threshold limit from the drop-down list. |
|
Memory Usage (MB) |
Type the memory usage threshold limit in MB in this field. |
|
Handle |
Select a threshold to monitor handle usage of a running process. |
|
Thread |
Select a threshold to monitor thread usage of a running process. |
|
Specific Process |
Provide Individual CPU and memory threshold for specific processes. |
3 Click the Add button.
EventTracker unfolds an option to type the process name.
4 Type the process name in the Enter Process Name field.
5 Click OK.
EventTracker adds the process to the List of Filtered Processes pane.
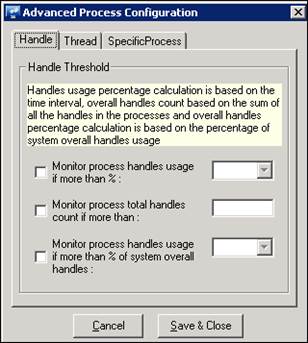
6. Click the Advanced button.
Advanced Process Configuration window displays.
7. In the Handle tab, select the handle counts as per requirement.
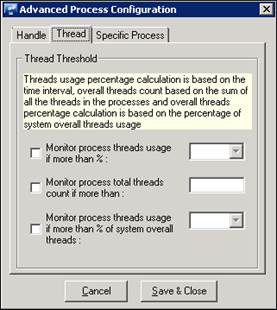
8 In the Thread tab, select the thread count as per requirement.
9 In the Specific Process tab, enter individual CPU and Memory threshold.
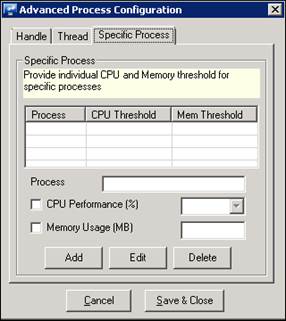
10 Click Add/Edit/Delete button as per requirement.
11 Click the Save & Close button.
|
2 NOTE |
|
EventTracker generates the process event when the set threshold value crosses the limit for more than 3 minutes. |
1 Double click EventTracker Control Panel, select EventTracker Agent Configuration.
2 Select the system from the Select System drop-down, and then select the Performance tab.
EventTracker displays the Performance tab.
3 Select the process from List of Filtered processes pane, select Remove and then select the Save button.
This option enables you to backup event logs automatically in the EventTracker Agent directory whenever the event logs are full. EventTracker automatically performs event log backup or archival in the standard Windows event log format (.evt /.evtx format).
1 Double click EventTracker Control Panel, select EventTracker Agent Configuration.
2 Select the system from the Select System drop-down, and then select the Log Backup tab.
EventTracker displays the Log Backup tab.

|
Field |
Description |
|
Clear logs as needed |
If selected, EventTracker Agent clears log file if and only if offset error is encountered. After clearing, Agent inserts “3241” event to notify the user. In this case, no backup is taken. This is true for any setting of the Windows Event Log’s “When maximum log size is reached” option (i.e. Overwrite events as needed, Overwrite events older than N days, Do not overwrite events (clear log manually)). EventTracker log backup and clear operation: Computer: EXCHTEST Log file name: Application Log file backup: Not applicable Log file clear: Success Reason: Received invalid offset error while reading the event log. For more information see Microsoft KB Article #177199. |
|
Backup event logs |
If the “Backup event logs” option is selected, and If the offset is lost at any point, no matter whether “Clear log after backup” checkbox is selected or not the respective log file will be backed up and cleared and the following 3241 event will be logged. EventTracker log backup and clear operation: Computer: EXCHTEST Log file name: Security Log file backup: C:\Program Files\Prism Microsystems\EventTracker\Agent\ EXCHTEST\ Eventlog_Backup_Security1221683647.evt Log file clear: Success Reason: Invalid offset error while reading the event log. For more information see Microsoft KB Article #177199. |
|
Backup Path |
By default backed up log files are stored in the EventTracker installation folder typically, …\Program Files\Prism Microsystems\EventTracker\Agent |
|
Keep backup files for |
If selected, backup files older than selected number of days will be automatically deleted by the agent. |
3 Select the required options and then select Save.
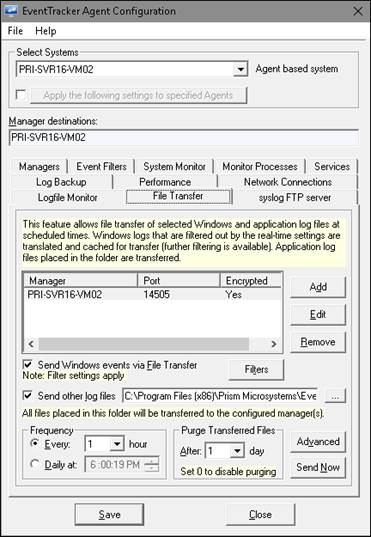
This option enables you to transfer Windows and other application log files at scheduled times to the manager. Windows logs that are filtered out by the real time settings are cached for transfer (further filtering is available). This minimizes the EventTracker Receiver service workload and conserves the network bandwidth.
A new option has been added to configure offline events. To achieve this configure the port to send offline events.
1 Double click EventTracker Control Panel, select EventTracker Agent Configuration.
2 Select the system from the Select System drop-down, and then select the File Transfer tab.
EventTracker displays the File Transfer tab.
|
Click |
To |
|
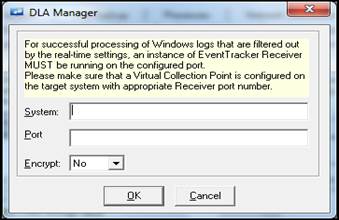
Add |
DLA Manager window displays.
a) Enter the System: name or IP address, Port to configure. b) If the events have to be encrypted is required, select Yes or No as per requirement. c) Select an option from the Encrypt drop-down list to encrypt and securely transfer the cached events to the destination. d) Click OK. |
|
Edit |
You can edit the manager name or IP address and even can change the encryption option. a) To update the details of Manager, click the Edit button.
b) Enter required information and then click the OK button. |
|
Remove |
Delete the destination, i.e. manager name or IP address. a) To remove file transferring of events in Manager, click the Remove button. EventTracker Agent Configuration displays a message.
b) Click the Yes button. |
|
Filter |
Click the Filter button.
Select the required options to Add/Edit/Remove/Find DLA Filters and click the Close button. |
|
Field |
Description |
|
Frequency |
Set the frequency of file transfer. You can set file transfer to occur every configure hours or daily at a particular time. |
|
Purge Transferred Files |
Set this option to purge files that are transferred to the Manager. |
|
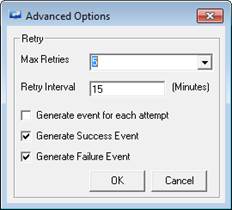
Retry |
Set the number of attempts made in a given time interval by the source Agent machine to transfer the files to the manager system. You can also generate an event for each transfer attempt, successful transfer or failed transfer as per your choice. |
|
Send Windows Events via File Transfer |
Select this option to transfer Windows events to the configured managers at scheduled interval. Click the Filters button to further filter the events. In DLA Filters dialog box, click Add to add the event details. |
|
Send other log files via DLA |
Select this option to transfer other application log files. Type the path the folder where log files are dumped or click the browse button to select the folder. |
|
Advanced |
a) Click the Advanced button. Advanced Option window displays.
b) Select the required options, and then click the OK button. |
|
Send Now |
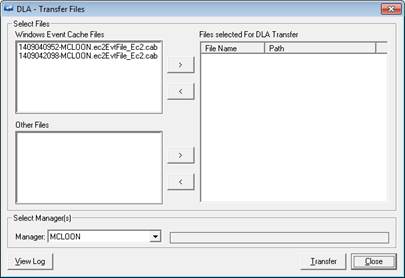
Click this option to override the Frequency option and transfer the files immediately. This option is available only under EventTracker Control panel >> File Transfer. a) Click the Send Now button. DLA – Transfer Files window displays.
b) In Select Files pane, select Windows Event Cache Files, and then select > button. c) Click the Transfer button. d) To view the logs, click the View Log button. |
3 Select the required options and then select Save.
This new feature is introduced to transmit windows events from local systems, as text files containing syslog messages.
1 Open EventTracker Control Panel, double click EventTracker Agent configuration and then select Syslog FTP server tab.
A Syslog FTP server window displays.

2 Click the Add button.
EventTracker opens Syslog FTP destination window.

3 Select the Protocol name, from the protocol dropdown list.
If you select protocol as FTP then port number 21 will be selected by default in the Port field.
If you select protocol as SFTP/SCP, then the port number 22 will be selected by default in the Port field.
4 Enter the server name or IP address in Server (Name/IP) field, where the syslog messages need to be transferred.
5 Enter the location in Directory field, where the files need to be transferred.
6 Enter the appropriate Username and Password.
7 Enter the host key in the Host Key field, which is provided by the System Administrator.
Host Key option is available only for SFTP/SCP.
8 Click OK.
The server details can be seen in the FTP server(s) field.
9 Click Send as syslog Events via File Transfer option to allow the file transfer to happen.
10 To send other log files, select Send other log files option, and then click the ![]() browse button.
browse button.
EventTracker displays Browse for folder pop-up window.
11 Select the log file folder, and then click Ok.
(OR)
Click the location where you want to create a folder, and then click Make a New Folder button.
EventTracker creates new folder under the selected location. Right click and rename the New folder, and then click Ok.
14 Select Also purge files on server if required.
15 Select Message Options to send/receive messages.
A syslog Message Options window displays.

16 Select the required Event Properties, syslog Format.
17 To add new syslog facility or severity settings in RFC 3164 syslog Facility Settings, select the New button. To edit/delete the settings, select the corresponding Edit/Delete button.
18 To add new syslog facility or severity settings in RFC 3164 syslog facility Severity Settings, select the New button. To edit/delete the settings, select the corresponding Edit/Delete button.
19 Select OK, select Save and then select the Close button.
All the files placed in this folder will be transferred to the configured manager.
This option enables you to save the current configuration settings in agent configuration.
1 To save current configuration settings, open EventTracker Control panel, and then select EventTracker Agent Configuration.
2 Select the system from the Select Systems drop down, select the File menu, and then select the Save as option.
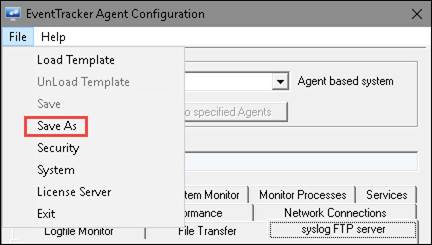
3 Select appropriate path to backup the current configuration settings. Enter the file name in the File name field.
The valid file extension is ‘*.ini’.
4 Click Save.
EventTracker displays the ‘EventTracker Agent Configuration’ message box.
5 Click OK.