![]() NOTE
NOTE
In case any EventTracker services are not running, a warning message is displayed when you log in.
EventTracker framework is EventTracker Security LLC flagship event log monitoring and management product. The EventTracker solution is a scalable, enterprise-class Security Information and Event Management (SIEM) solution for Windows systems, Syslog/Syslog NG (UNIX and many networking devices), SNMP V1/V2, legacy systems, applications and databases.
EventTracker is a reliable and practical software-only solution, to monitor, track, and manage critical events that 2012 R2/10/2016/2019, MSCS system(s) and UNIX-style syslog in your enterprise.
Installation of EventTracker is quick, simple, and intuitive. EventTracker comes with a thorough resource kit with several nifty utilities, which alleviates the pain of day-to-day administration of your enterprise network. Log Volume Analysis is similar to Log Analysis but with more bells and whistles, which gives you an incisive insight into the event traffic flow in your enterprise.
n Agent Optional Architecture
n Cross-platform support
n Centralized Warehouse
n Auto back-up / clear native event logs
n Real-time Alerts
n Event Correlation
n User tracking
n Process, network and service monitoring
n Granular filtering
n Change auditing
n Virtual Collection Points
n Execute Remedial Actions
n Monitor file transactions that occur in the inserted media (USB or other devices)
n Generate audit reports based on Collection Point Sites
n Manage Active Directory (AD) Organizational Units (OU)
n SID translation
n Generate audit-ready compliance reports (HIPAA, SOX, FISMA, GLBA, PCI)
n Casebook
n Parsing of token
n Persist data
n Instant search option
Service |
Description |
Startup Type |
Logon as |
Allow service to interact with desktop |
Event Correlator |
Correlates the received events from the agent and performs the action based on the rules. |
Automatic |
Local System account |
Yes |
EventTracker Agent |
Relays local log data and is usually managed by the central EventTracker Console. If uninstalled locally, corresponding changes will be necessary at the Console. May be restarted to pick up new configuration. Performs configuration assessment for received requests and sends back the assessment results. |
Automatic |
Local System account |
Yes |
EventTracker Alerter |
Used by EventTracker to manage RSS notifications generated via Alerts. |
Automatic |
Local System account |
Yes |
EventTracker EventVault |
An EventTracker component to compress and securely store the raw log data. |
Automatic |
Local System account |
Yes |
EventTracker Indexer |
Responsible for indexing the key words of event properties. Event properties include Computer, Source, EventID, Domain, User, LogType, EventType, and Description. |
Automatic |
Local System account |
Yes |
EventTracker Receiver |
Enables EventTracker to receive log data from the configured sources. If stopped, EventTracker cannot function. May be restarted to pick up new configuration. |
Automatic |
Local System account |
Yes |
EventTracker Remoting |
This service is used to send any request (like install agent/upgrade agent/uninstall agent etc.) to communicate with the EventTracker agent service and log search. It is also responsible for generating Sparse Matrix. |
Automatic |
User Account |
Yes |
EventTracker Reporter |
Responsible for reports / Flex Report execution. |
Automatic |
Local System account |
Yes |
EventTracker Scheduler |
Used by EventTracker to initiate scheduled activities like CAB integrity verification, traffic analysis. Also initiates User Activity monitoring and ‘Collection Point’ related activities. Fetches configuration assessment requests from queue and dispatches the request to EventTracker agents running on target system. |
Automatic |
Local System account |
Yes |
WcwService |
Used to take periodic snapshots and entertain change assessment requests. |
Automatic |
Local System account |
Yes |
Trap Tracker Receiver |
Receives traps in the form of an alert or other asynchronous event about a managed subsystem. |
Automatic |
Local System account |
Yes |
|
In case any EventTracker services are not running, a warning message is displayed when you log in. |
EventTracker Module |
Ports |
EventTracker Agent |
14506/TCP |
Windows Receiver |
14505(TCP/UDP) - optional and multiple VCP’s can be configured |
Syslog Receiver |
514(UDP/TCP) can be configured to any number of ports |
Collection Master |
14507/TCP - optional and can be configured to any TCP port |
Correlation Receiver |
14509/TCP |
EventTracker – Change Audit Agent |
14502 (TCP) - to transfer snapshot between client and Server. 14508 (TCP) - used for real-time comparison of any system with the golden snapshot located at the server. |
License Server |
14503/TCP |
EventTracker Active WatchList |
14504 |
**In case the user creates multiple Virtual Collection Points, make sure the port used does not contradict with the Default ports used.
1 Click Start , select All Programs, and then select Prism Microsystems.
2 Select EventTracker, and then select EventTracker Enterprise.
(OR)
Double-click the EventTracker shortcut on desktop.
EventTracker displays the login page.
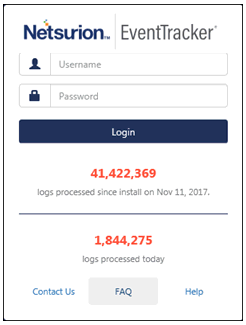
Click |
To |
Contact Us |
Go to ‘Contact page’ on EventTracker Web site. |
FAQ’s |
Go to FAQ page. |
Help |
View online help. |
EventTracker displays the logs processed information only when a CAB file is created locally on the server.
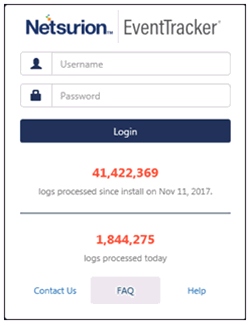
3 Type valid user credentials, and then click Login.
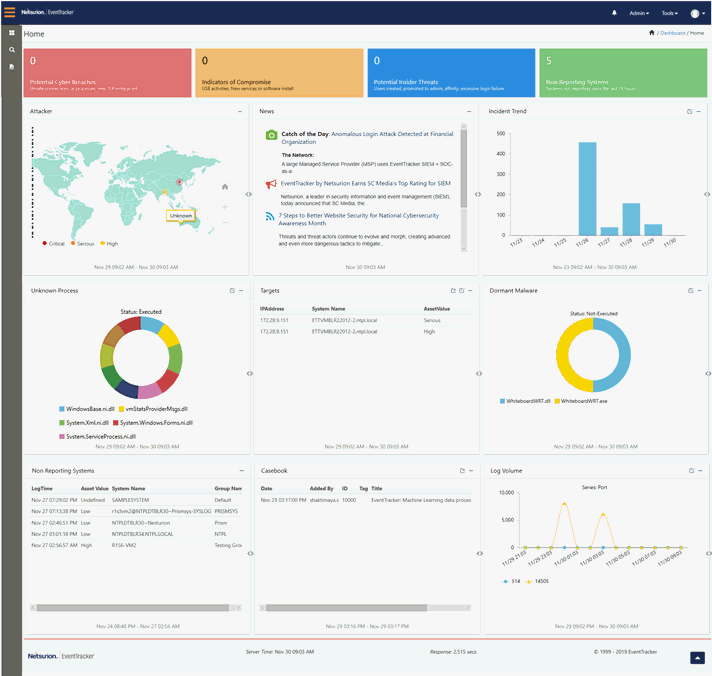
EventTracker displays the Home page.
For “Admin given privileges to a user”, the EventTracker login page will be displayed as below with the Start In: field.

The user can select any other option from the dropdown list to be displayed as the home page.
Now, log into EventTracker web portal. The Home page is viewable.
EventTracker Dashboard menu consists of following menu’s as mentioned in the table.
Click |
To |
DASHBOARD |
|
Home |
Customize and view Dashboards for Attackers, Log Volume, Incident Trend, Unknown Process, Targets, Dormant Malware, Non Reporting System and Casebook. |
My Dashboard |
Helps to view quick statistics and graphs like trend of events based on any flex persisted data. |
Threats |
View Attackers and Targets Dashboard and Analyze Unknown Processes. |
Incidents |
Analyze alert events occurred in all managed systems. |
| MITRE ATT&CK™ | The MITRE ATT&CK™ provides a well-defined standard for attack identification and protection. |
Machine Learning |
Add/remove enterprise activity dashlets. Configure, customize, and reset dashlets. Generate volume analysis reports. |
Change Audit |
Helps to analyze voluntary and involuntary changes occurred in managed systems. |
Compliance |
View the data for compliance in this Dashboard. |
SEARCH |
Perform a Log Search/Elastic Search |
REPORTS |
Consists of Security, Operation, Compliance and Flex Reports |
2 NOTE |
You may not be able to see some of the features in the EventTracker menu, if required license is not purchased. |
4 Click the Admin option at the upper-right corner.
DO NOT click on Admin drop down.
1 Click the on the Admin dropdown.
It consists of options that help you to quickly access EventTracker modules.
Click |
To |
|
Import lists of ip address, process, users, etc for managing threat information. |
|
Manage Alert Configuration including notification and threat level. |
|
Define and manage Machince Learning Jobs . These are used to display behavior dashlets in the Security, Operations tabs. |
|
Configuring settings for the "machine leaning" module. |
|
Customize Casebook entry columns as per your enterprise requirements. |
|
Event categories are used in reports, search and views. Pre-defined categories of knowledge are available. Users may create/edit categories. |
|
EventTracker ‘Collection Master’ collects CAB files forwarded by Collection Point(s). |
|
Diagnostics displays Disk Usage status, VCP statistics, etc. |
|
Configure manager side event filters to avoid archiving specific events. |
|
Functions as warehouse for CAB files. Manage archives and configure retention and validation. |
|
Configure FAQ tiles to display in Home/ Alerts/Systems and Report. |
|
Configure Alert action email based on system group |
|
Customizable IP Address verification/detailed information. |
|
Knowledge objects are used for identification and extraction of meaningful information from the logs received. |
|
Define Virtual Collection Points, enable Syslog, configure DLA, enable NetFlow receivers etc. |
|
Parsing Rules |
|
Manage settings that affect report generation and e-mail delivery. |
|
Manage EventTracker Windows agent and Change Audit agent. |
|
Manage privileges and permissions of the users defined in the EventTracker user group. |
|
Assign weight values to Event Source, Event ID, Categories, etc. These are used in the tag cloud display in the Search/Refine dialog (EventTracker Log Search). |
|
Manage configuration of EventTracker Windows Agent. |
2 NOTE |
You may not be able to see some of the features in the EventTracker Admin menu, if required license is not purchased. |
TOOLS |
|
Casebook |
An electronic book in which users can add entries from Incidents, Reports, Change Audit, Config Assessment |
Event Config |
Enable/disable events generated in Change Audit and Direct Log Archiver. |
Summary report Config |
Instead of reviewing dozens of generated persists reports, this report will give complete user specified fields in a single report. |
Knowledge Base |
Go to EventTracker Knowledge Base Web site |
LogWatch |
To monitor incoming data continuously as per user query. |
Sitemap |
View index of the web site. |
2 NOTE |
You may not be able to see some of the features in the EventTracker Tools menu if required license is not purchased. |
1 Select the Start button, select All Programs, and then select Prism Microsystems.
2 Select EventTracker, and then select EventTracker Control Panel.
(OR)
Double-click the EventTracker Control Panel shortcut on desktop.
EventTracker displays the login page.
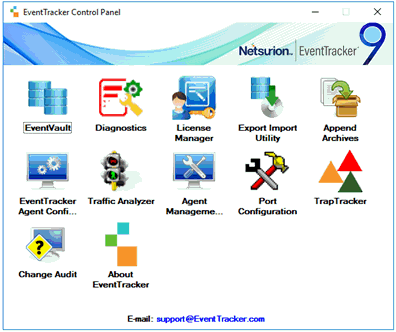
2 NOTE |
You may not be able to see some of the features in the Control Panel, if required license is not purchased. |
3 To open a module, click the respective icons.
Click |
To |
|
Functions as warehouse for CAB files. Manage archives and configure retention and validation. |
|
Alerts if any problem occurs in the EventTracker.
|
|
Provides license details, features opted for, license usage of EventTracker. |
|
Enables you to export/import custom Categories, Filters, Alerts, Scheduled Reports, Domains, Systems, RSS Feeds, and Behavior Rules during migrate/upgrade process, and to transfer EventTracker data from one system to the other in your enterprise. |
|
Use this utility to merge backup CAB files. Indexing is done automatically. |
|
To configure the system for reporting to multiple managers, to filter events, to monitor services, software installations, processes, system health, and to archive the events database. |
|
To analyze event traffic patterns. The data can be used to filter out irrelevant events and perform other operation tasks. |
|
A diagnostic tool to check the health status of remote agents, restart the failed agent services and to check the version of remote agents. |
|
To change the port and monitor the websites and its corresponding applications. |
|
To manage traps received from SNMP enabled devices. |
|
An application that used to track the occurred changes on a computer’s file system and registry and provides you with a lifeline to restore it back to a working configuration. |
|
View License Usage, updates applied and other details. |
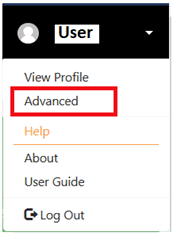
The user can view here the profile details.
1. Click Advanced.
User Preference window displays.
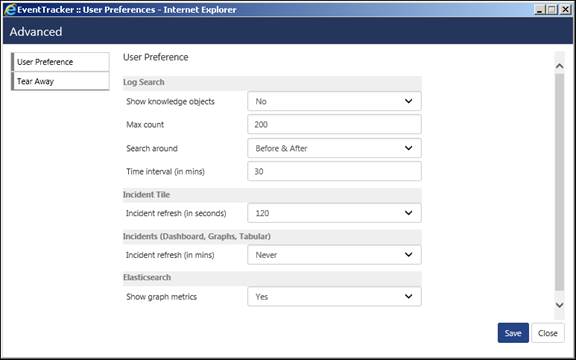
2. Select Show knowledge objects: option.
3. Enter Max count: to be displayed.
4. In the Search around option, the user can specify the time range to search a particular event property. Select the option from the dropdown list.
5. Enter the appropriate Time Interval.
The user can also configure the Incidents refresh time and can enable or disable the “Show graph metrics” option for the Elasticsearch and then click the Save button.
6. Select Tear Away option.
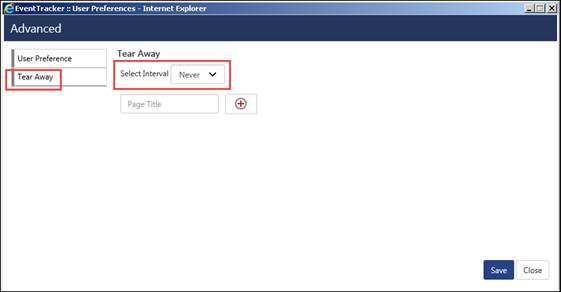
7. Select the desired Select Interval: option.
8. The user can create a customized page and add dashlets to the created page.
9. Enter the Page Title and to add it click![]() .
.
In this example, we are adding “My Page”.
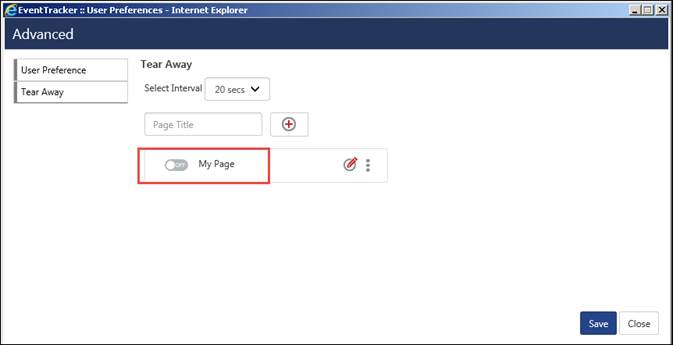
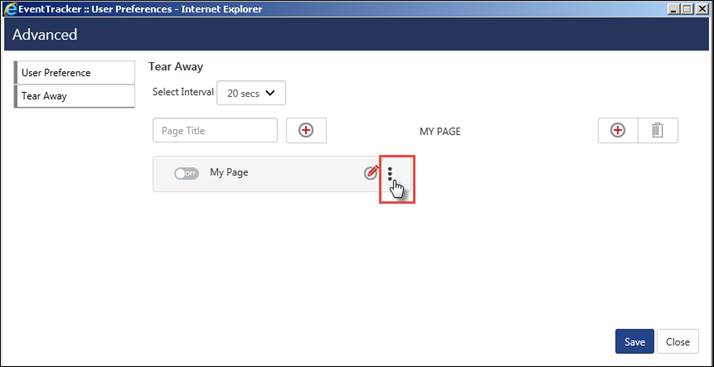
10. Now
to add dashlet(s) to the crested page, click![]() .
.
11. Select
the Add ![]() icon.
icon.
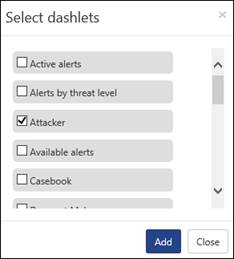
12. Select from the available list of dashlet(s) and click Add.
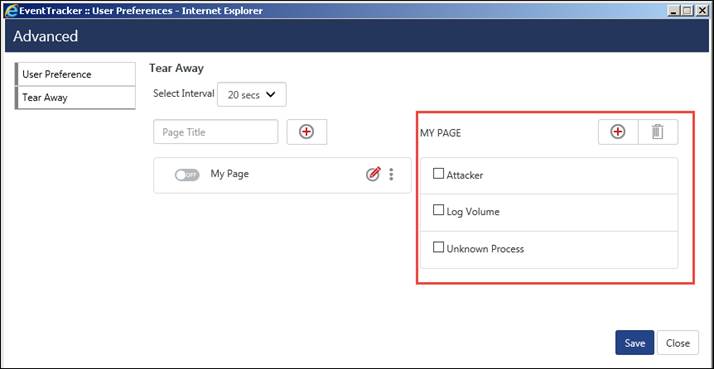
The Dashlet(s) gets added for “My Page”. Select them and Save them.
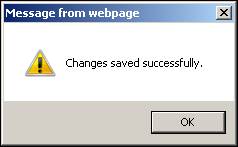
The below message displays:
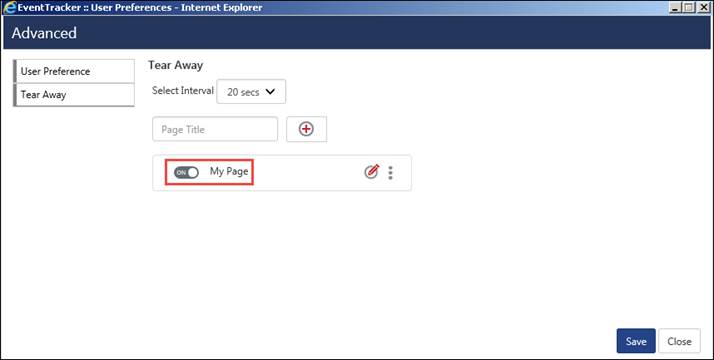
To make it active, turn it to the “ON” mode.
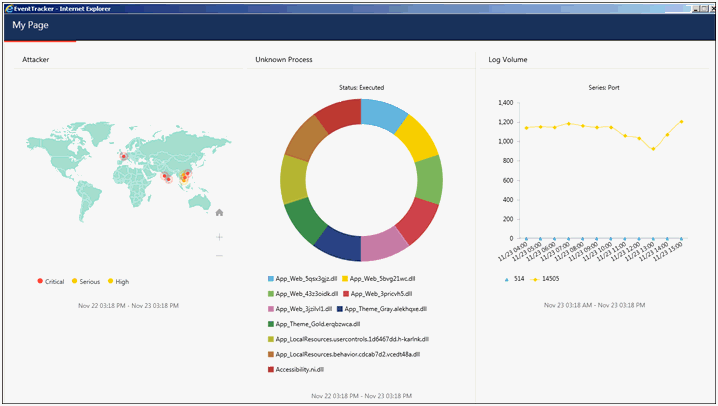
The created page will keep on displaying the selected dashlets in a new window and will refresh every selected (20 secs/1min/2 min...) interval.
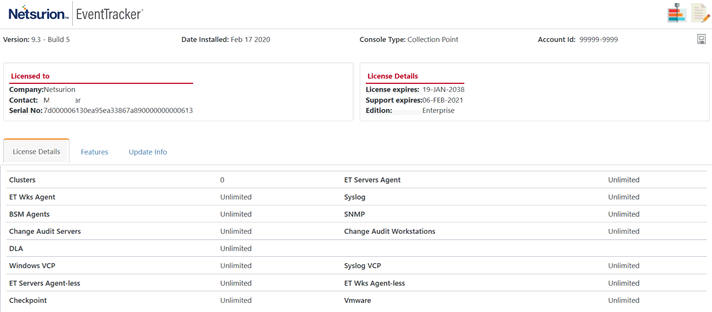
1. Click the Help menu, and then select About.
License Details opens.
2. Click the ![]() icon
to save the license details.
icon
to save the license details.
3. To view the features that have been installed, select Features tab.
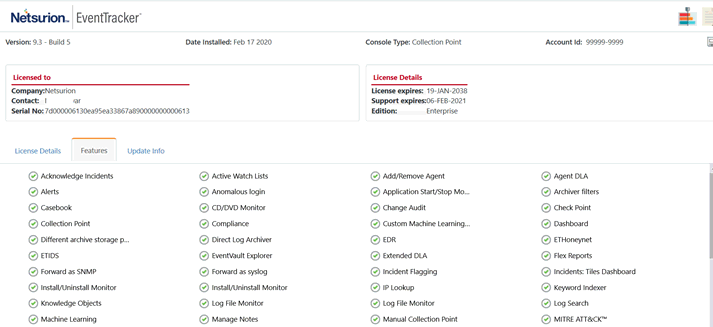
4. Click Update Info to view the updates installed, if any.
1. Click the Help menu, and then select Contents.
The EventTracker User Guide for the respective version opens.
NOTE: This is applicable only for IIS Webserver.
Follow the steps mentioned below:
1. Go to Start> All Programs>Internet Information Services (IIS) Manager.
OR
2. Go to Run option and type “inetmgr” to open the IIS Manager.
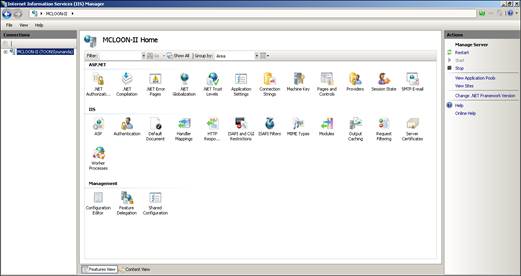
3. Select the Application Pool node available in the left pane and select ASP .NET v4.0 Classic.
4. Select the option Advanced Settings… in the Action pane as shown in the figure below:

The Advanced Settings window opens.
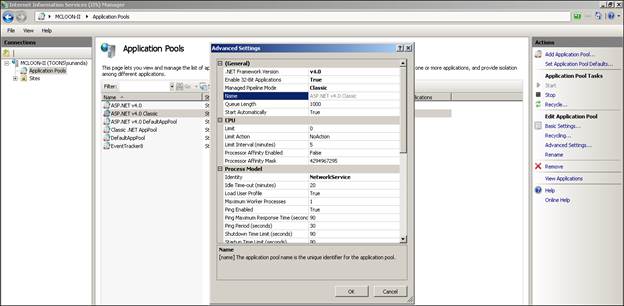
5. In the Recycling pane, the Regular Time Interval (Minutes) is 1740 (29 hours) by default.

6. Change it to 0 (Zero) and save the configuration by clicking OK.
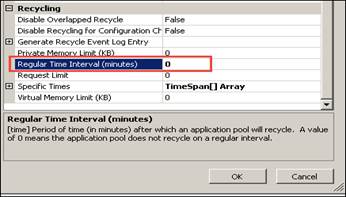
7. Now, Reset the IIS and login to EventTracker web.
8. Click the Tear Away icon![]() .
.
9. Make sure you are in the News Page, so that the tear away window gets refreshed every 1 min.
This option helps you in updating the EventTracker configuration, if
n New users are added to the "EventTracker" user group
n You face Log on issues
1 Select the Start button, select All Programs, and then select Prism Microsystems.
2 Select EventTracker, and then select Update Users List.
EventTracker displays Update EventTracker Users console.
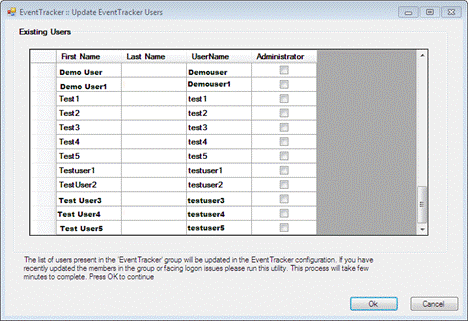
If a non-admin user is promoted as an Administrator then checkbox against the user is selected. To promote a non-admin user, please refer Promote a User as an Administrator section.
3 Click Ok.
EventTracker updates ‘EventTracker Configuration’ and displays the success message.

NOTE:
If the user with which EventTracker Configuration runs has changed the password, it is mandatory to re-run the EventTracker Configuration with the updated password.
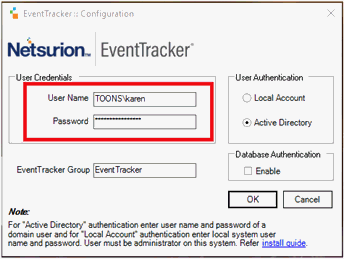
i. To find ‘EventTracker Configuration’, select the Start button, select All Programs.
ii. Select Prism Microsystems, select EventTracker, and then select EventTracker Configuration.
iii. Enter appropriate credentials and then select theOK button.
This option enables you to log out of EventTracker.
A) To exit
EventTracker, click the Log out ![]() icon.
icon.
EventTracker logs you out gracefully.
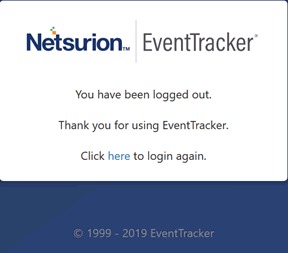
2 NOTE |
When two users log in with the same user credentials, EventTracker logs out the first user and allows the second user to create the session. |
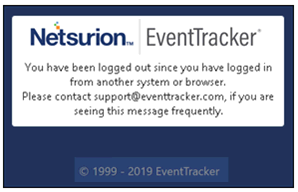
2 NOTE |
When there is no user interaction for a specified period of time, EventTracker logs out the user. |
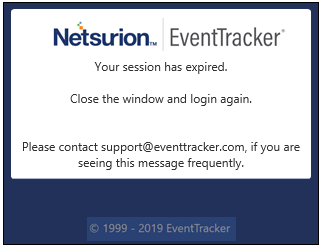
2 NOTE |
EventTracker denies access, when a user tries to log on without appropriate access permissions and privileges. |
